A map for adding value: how to collaborate smarter with ecosystems
Head of Thought Leadership
Strategic Marketing Director
5G Strategy and Innovation Director
Director Cloud Strategy Execution
Strategic Marketing Director
Head of Thought Leadership
Strategic Marketing Director
5G Strategy and Innovation Director
Director Cloud Strategy Execution
Strategic Marketing Director
Head of Thought Leadership
Strategic Marketing Director
5G Strategy and Innovation Director
Director Cloud Strategy Execution
Strategic Marketing Director
Listen here
In the previous episodes of our ecosystem evolution series, we discussed how the intersecting ecosystems of cellular 5G, IT and vertical industries are changing and diversifying, and looked at the different lenses that can be used to understand these ecosystems. There is a great deal of conversation happening around ecosystems now, with one of the key discussion points centering around how to map out the relationships between players in a way all stakeholders can understand, particularly as there are many different ways to visualize them.
Our goal has been to create a visual framework that links together users, networks, and the cloud in a more granular way than usual. With different overarching categories applied across the framework, it not only provides a more hands-on overview of the complex relationships involved. It also enables stakeholders to better understand one another and their roles in cross-industry collaborations – and to identify exciting new opportunities for adding value.
By the end of this episode, you will have a better understanding of:
- What building blocks connect end-users, networks, and the cloud.
- A framework we can start using to visualize interactions and dynamics between players.
- How you can assess ecosystem evolution in your market, to identify opportunities and take a more favorable role.
The ecosystem framework
To visually describe complex ecosystems, positioning several types of players and their relationships, we wanted to create a model that is both intuitive and easy to use, while at the same time providing enough depth to be meaningful and instructive. Existing frameworks have various trade-offs – they are either static and only provide a snapshot of where things are today, or dynamic and represent changing realities but with less precision.
For our purposes, we decided to use a player-centric ecosystem framework. In that context, we define an ecosystem simply as “any network of organizations that are involved in delivering solutions to address customer needs, and that can add additional value through collaboration.” With this definition, we keep the focus on the ecosystem players, their roles, how they interact with each other and how they contribute to deliver a solution to a customer – the beneficiary of the ecosystem.
The intersecting ecosystems (IT, 5G and vertical industries) and the five different perspectives, or lenses, all require an understanding of the roles, capabilities and value provided by different players. But the challenge is how to apply this in different contexts, such as offering devices and applications, platforms, or connectivity. By considering the attributes that connect these ecosystems, we first identified seven basic building blocks, against which different ecosystem types, lenses, and roles can be mapped.
The seven basic building blocks are professional services, application, device, connect, network, store and compute. These are then categorized into three layers – the front-end layer, the communication layer and the back-end layer. At the core of the framework, we have the beneficiary – the customer or user that benefits from the ecosystem or the solution put in place.
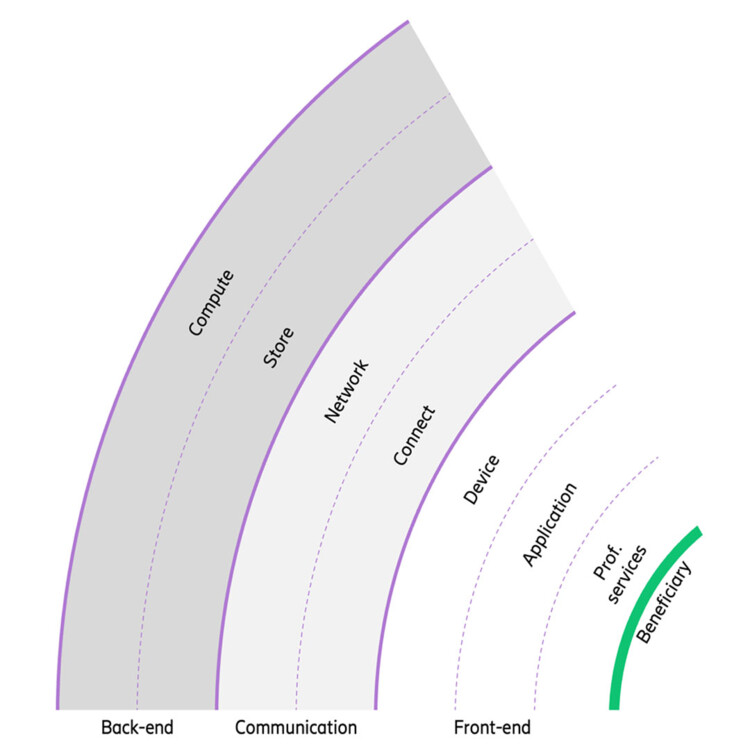
The seven basic building blocks of the ecosystem mapping framework, divided into three main layers – the front-end, communication and back-end layers.
The front-end layer: professional services, application and device
In this first layer, we see a variety of players including professional services from consulting firms to system integrators, application providers as well as a multitude of device manufacturers. Consider the gaming industry, for example. This layer would include participants such as console (Xbox) and PC (Dell) manufacturers, game developers and publishers (Electronic Arts). But there are also, crucially, the platform providers such as Nvidia GeForce acting as orchestrators.
The communication layer: network and connect
Next comes the communication layer, consisting of communication service providers (CSPs) and network equipment providers. These players are active in variety of roles, from being a basic contributor to an orchestrator. Consider a place-centric ecosystem such as smart stadiums, where -a CSP can potentially orchestrate highly immersive on-demand viewing experiences by collaborating with streaming providers, as well as stadiums setting up advanced 5G connectivity infrastructure.
The back-end layer: store and compute
Finally, we look at the back-end layer, which has a significant play from the IT industry. Consider automotive manufacturing, looked at through the lenses of technology and process. Here we see a greater need for high computation capabilities like artificial intelligence (AI) and data analytics to automate processes towards better productivity and efficiency, meaning faster compute and large storage capabilities.
Characteristics and structure of the ecosystem
To understand the concrete steps to be taken, one first needs to understand the characteristics and structure of the ecosystem. These include the maturity level of the ecosystem, the players (stakeholders) in the different layers, their roles and how those players collaborate and interact with one another. In our framework, such ecosystem characteristics can be easily mapped and labeled.
- Player position and role are represented by circles in blue (orchestrator), orange (contributor) and beneficiary (green).
- Player relationships are represented by lines between players.
- Ecosystems are identified with an outline enclosing all the relevant players, with the ecosystem maturity and lens represented with icons in the upper corners.
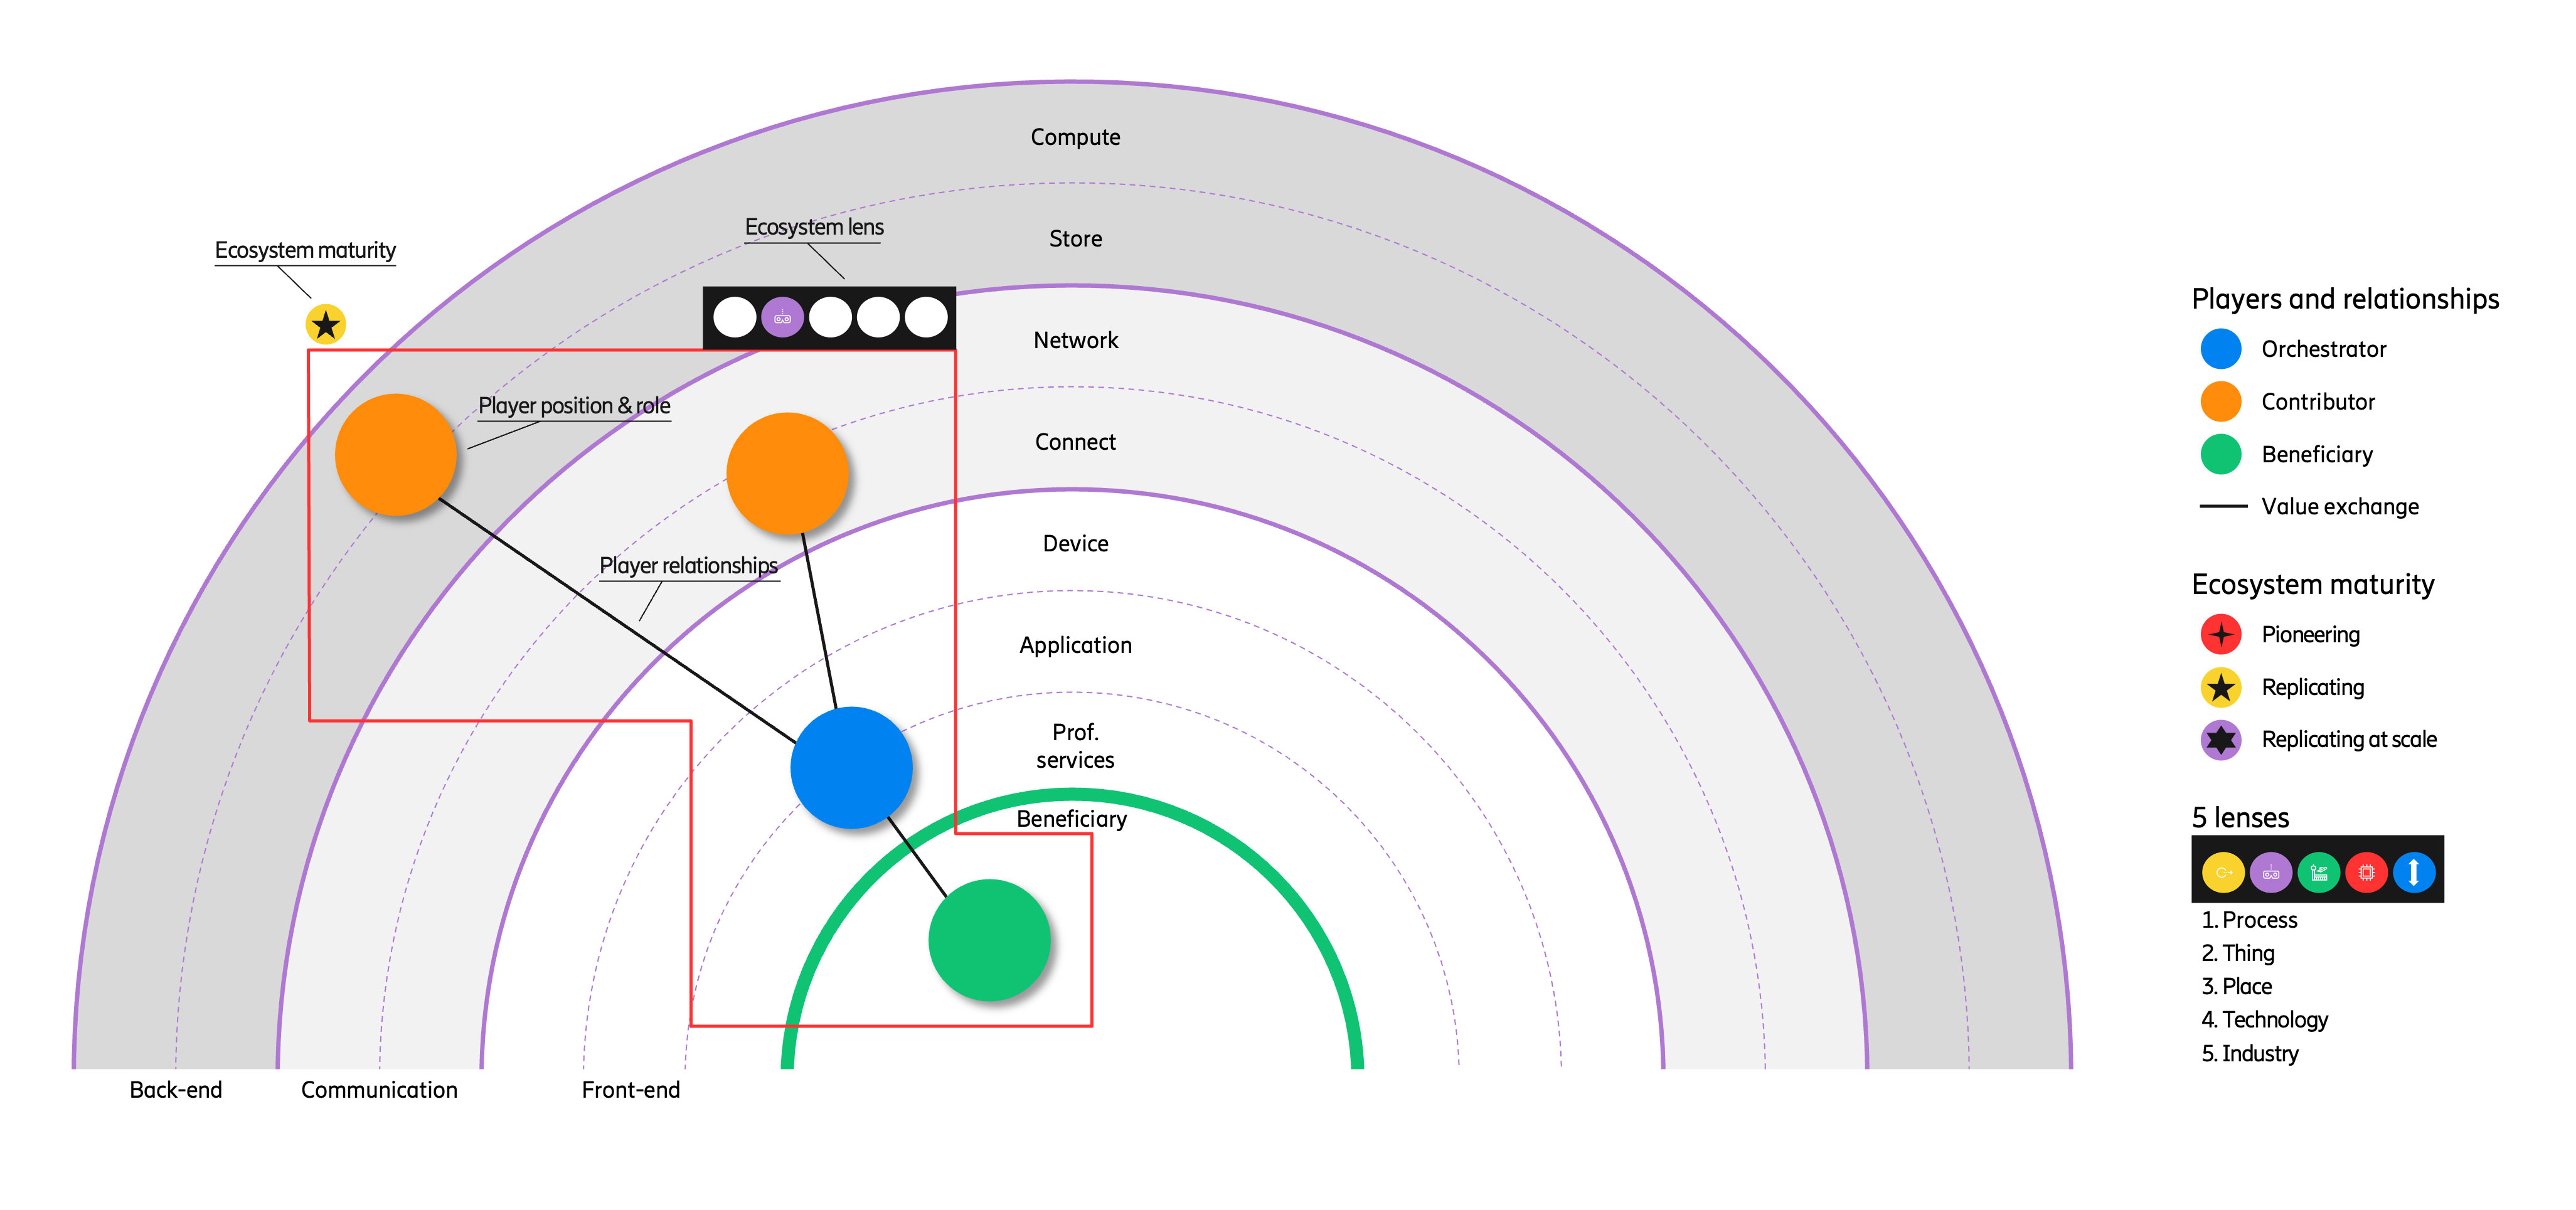
An ecosystem mapped within the framework, displaying the different ecosystem characteristics.
The importance of ecosystem characteristics and maturity
It’s important to consider the maturity level of an ecosystem, as this will impact the strategies and tools that need to be applied. The connected truck, for example – a thing-centric ecosystem – is strongly related to other ecosystems like the truck industry ecosystem, the fleet tracking ecosystem and the platooning ecosystem. But all these ecosystems are currently at different maturity levels.
Mature ecosystems
In the overall truck industry ecosystem, which is very mature, the main strategy to grow for established players is to replicate at scale. The truck industry had a revenue of over USD 732 billion in 2020 in the United States alone, and centers around delivering cargo with long-haul trucks. Mature ecosystems typically have a low-medium growth (0-10 percent compound annual growth rate, or CAGR), locked-in standards, mature technology and established orchestrators – in this case, truck manufacturers like Daimler or Volvo Trucks.
Semi-mature ecosystems
The fleet tracking ecosystem, however, is a semi-mature ecosystem that centers around a process enabled by a suite of platforms and software allowing for efficient route planning and fleet management. Such semi-mature ecosystems typically have a medium-high growth (10-20 percent CAGR), several similar competing firms vying for the orchestrator role, multiple solutions on the market but no “go-to” standard, and several players trying to dominate the market. Here you would focus first on how to replicate solutions that are proven through early customer engagements, then on scaling the offering.
Immature ecosystems
The platooning ecosystem, in comparison, is an immature ecosystem. It focuses on driving trucks in proximity to save fuel and increase the road capacity and operation of several trucks with just one driver. Here, pioneering a solution and collaborating with many stakeholders from diverse backgrounds is key in order to really deliver a strong solution first. Innovation centers like Ericsson D-15 provide the ideal environment where players can innovate together while taking advantage of the latest 5G technology.
All contributors look forward to the potential to scale, fast and high, once their solution is proven for a market segment. It is much harder to enter the market with these types of innovations later, or aspire to copy an established leader. Immature ecosystems have a high growth (>20 percent CAGR), there are many actors, it is very unclear who will take the orchestrator role, technology is quickly developing with competing standards and business models are still developing too.
Dynamics in the ecosystem
With all the building blocks working together, there is bound to be a variety of dynamics among the different layers when the 5G, IT and industry ecosystems are interacting together to unlock the full potential of their solutions or collaborations. These dynamics can involve transactions in different directions and across layers, with greater value potential as the end objective.
In our framework ecosystem, these dynamics are handled via indicative arrows, changes in size, colors, and new objects. Dynamics within the ecosystem framework can be handled and visualized in a variety of ways.
- Expanding and evolving ecosystem maturity.
- Changing maturity icons representing changing maturity levels.
- Expanding ecosystem ‘box’ representing the ecosystem’s growth (or vice versa).
- New player entrants represented by circles with a dotted border.
- Player role changes, expansions and contractions or moves up and down the layers are handled by changing the color, size and/or position of the player circle, respectively.
It is important to note that as players can take distinct roles in different ecosystems, they can be represented more than once in the visualization.
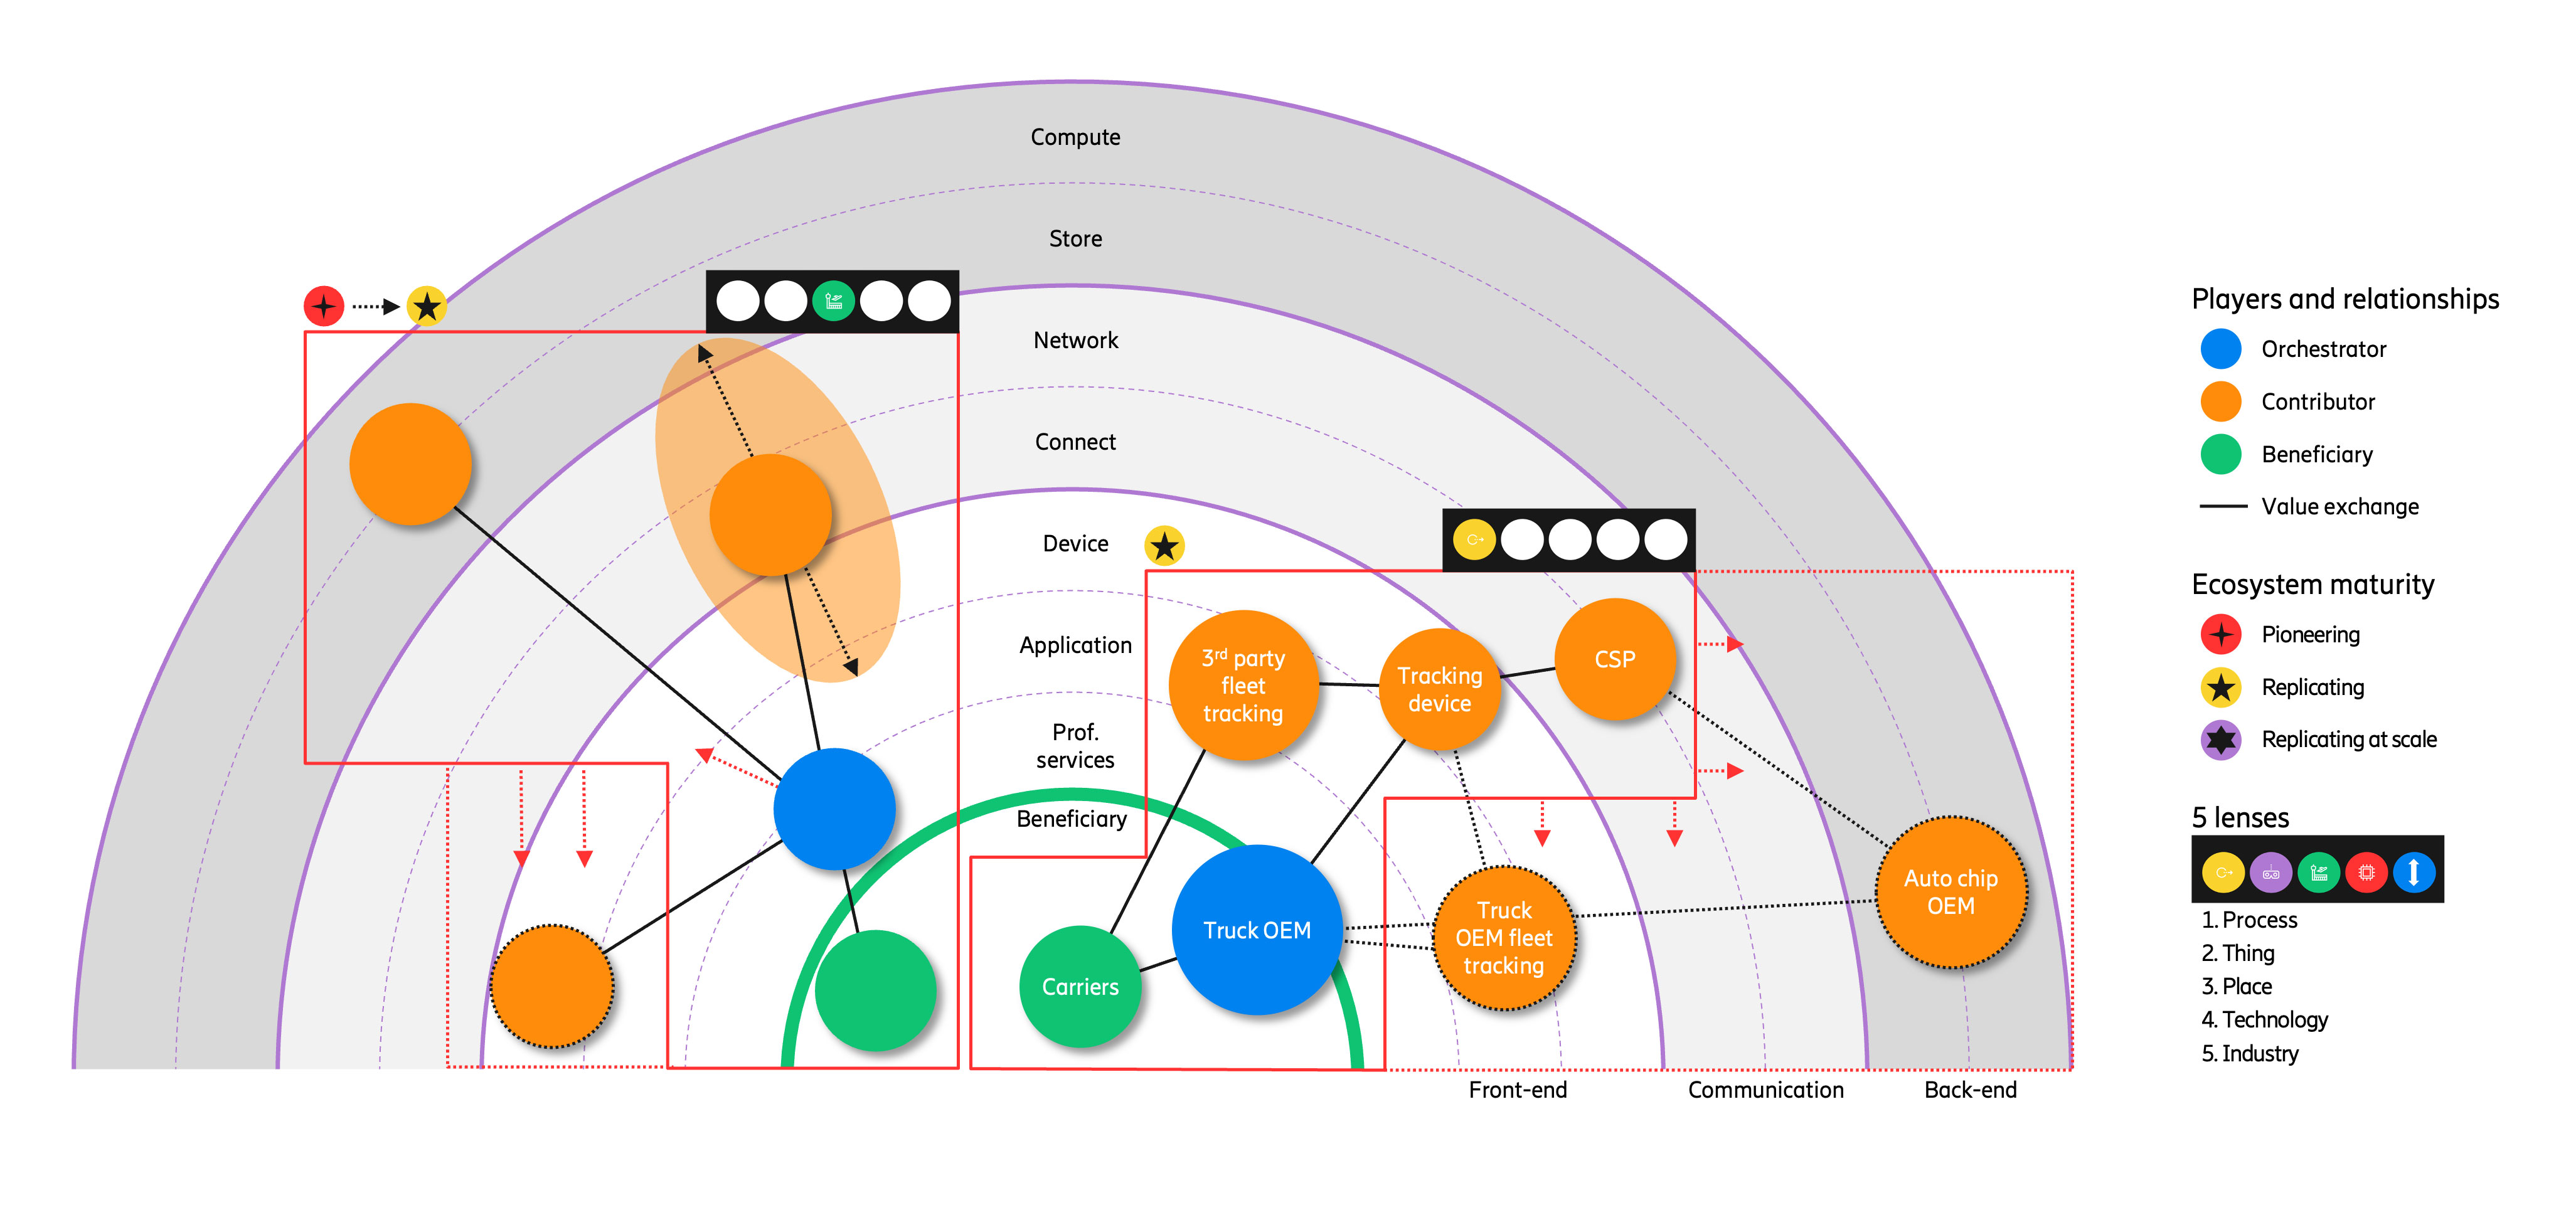
The framework can even be used to map complex ecosystem dynamics.
Building real value with ecosystem collaborations
Once you have a clear understanding of the players, roles and relationships interacting in your ecosystems, you have an excellent resource to identify new opportunities to collaborate, with an ultimate goal of increasing value and innovating new offerings.
Consider the earlier connected trucks example, where we see Qualcomm – a chipset manufacturer – entering the automotive space with their Snapdragon Ride platform, powering Advanced Driver Assistance Systems (ADAS) features in new GM cars from 2023 onwards. Their automotive chip provides a computation and connectivity module for the truck. Moreover, truck manufacturers are entering the application layer with advanced tracking capabilities, for example, Daimler’s platform Detroit Connect, which integrates fleet tracking provider Zonar’s offering.
Another example can be found in retail, where the payment process is typically orchestrated by a bank. Now, a new player like Square challenges traditional banks by offering an alternative point of sale (PoS) solution which includes a range of merchant services including sales transactions, enabling the end-to-end payment process to be managed directly by retailers.
Communication service providers (CSPs) that provide in-store connectivity also have bank relationships, and often have a direct customer relationship with retailers which they could leverage to take a more favorable role in the ecosystem. So, for example, a CSP could become the orchestrator for the payment process in retail by embedding Square’s PoS solution in their existing retail platform. For Square, that could mean a stronger partner in the go-to-market, where they could leverage the CSPs relationships with additional retailers. For the CSP, it would increase their market share in the payment process within retail – a solution where both players benefit.
So, where do you begin?
We’ve established a stepwise guide with questions to help you understand your scenarios, identify new opportunities and better position your capabilities with the support of our mapping framework.
Step 1 – Decide where to play
- What ecosystems should I engage with?
- What are the characteristics of each ecosystem involved – what is the maturity level of the ecosystem, who are the different players across all the layers, what are their roles and how do they collaborate today?
- What are the key trends, the technological drivers, and the market drivers in each ecosystem?
Step 2 – Decide with whom and how to play
- What are the dynamics and interaction in this ecosystem?
- What are the different moves of the key players and their value transactions?
- What role and position am I taking today?
- What role and position should I take tomorrow?
Step 3 – Decide on where to start and how to get there
- Which opportunities do I want to pursue in my presumed role?
- What do I need to do to get there?
- What is my immediate next step?
Are you ready to get started?

Sign up for the ecosystem evolution blog series
Don't miss out - sign up today and be notified of each blog post episode as it is released.
Sign up now
Contact the authors
We would be eager to hear how you apply the framework and what you learn in terms of positioning your key capabilities as the building blocks. Please don’t hesitate to reach out to discuss your experience, if you have questions about the framework or if you have any suggestions for how you would like this series to end. You can contact the authors via email or reach out to them directly via their LinkedIn profiles: Peter Linder, Harald Baur, Giovanni Zappelli, Carlos Bravo or Taimur Lhodi.
Acknowledgment: The authors of this ecosystem evolution blog series would like to acknowledge the work and contributions of Arthur D. Little, who conducted a joint analysis with us earlier in 2022.
Read more
Download the one-page cheat sheet summarizing the key messages from this post.
Find out more about our ecosystem evolution blog series.