Backhaul end-site capacity: Guesswork or science?
Systems Manager, Transport Systems
Systems Manager, Transport Systems
Systems Manager, Transport Systems
Ericsson Mobility Report
Our work on the end site capacity table in Microwave Outlook 2020 starts with the Ericsson Mobility Report (June 2020 edition). Since 2011, the Ericsson Mobility Report has been a leading source of knowledge on the state and future of the mobile world. Published twice a year, the report provides us with fundamental data we then use as input: mobile subscription outlook, 5G device outlook, and mobile data outlook.
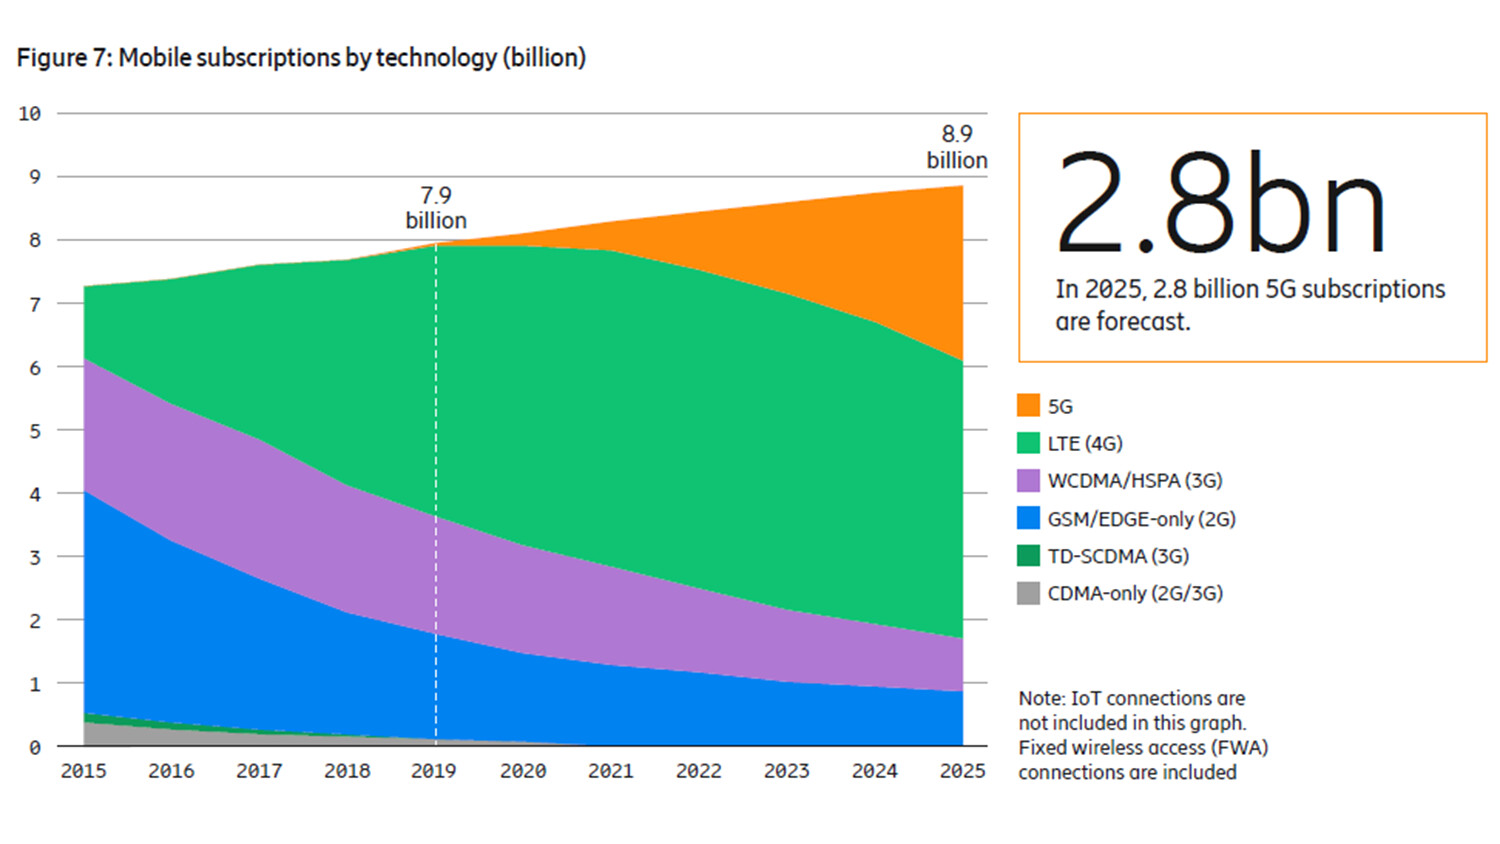
Mobile subscription outlook
5G is driving up data volumes and bandwidths. It is crucial that we understand 5G subscription uptake speed – not only as a total number but also per market to see regional variations.
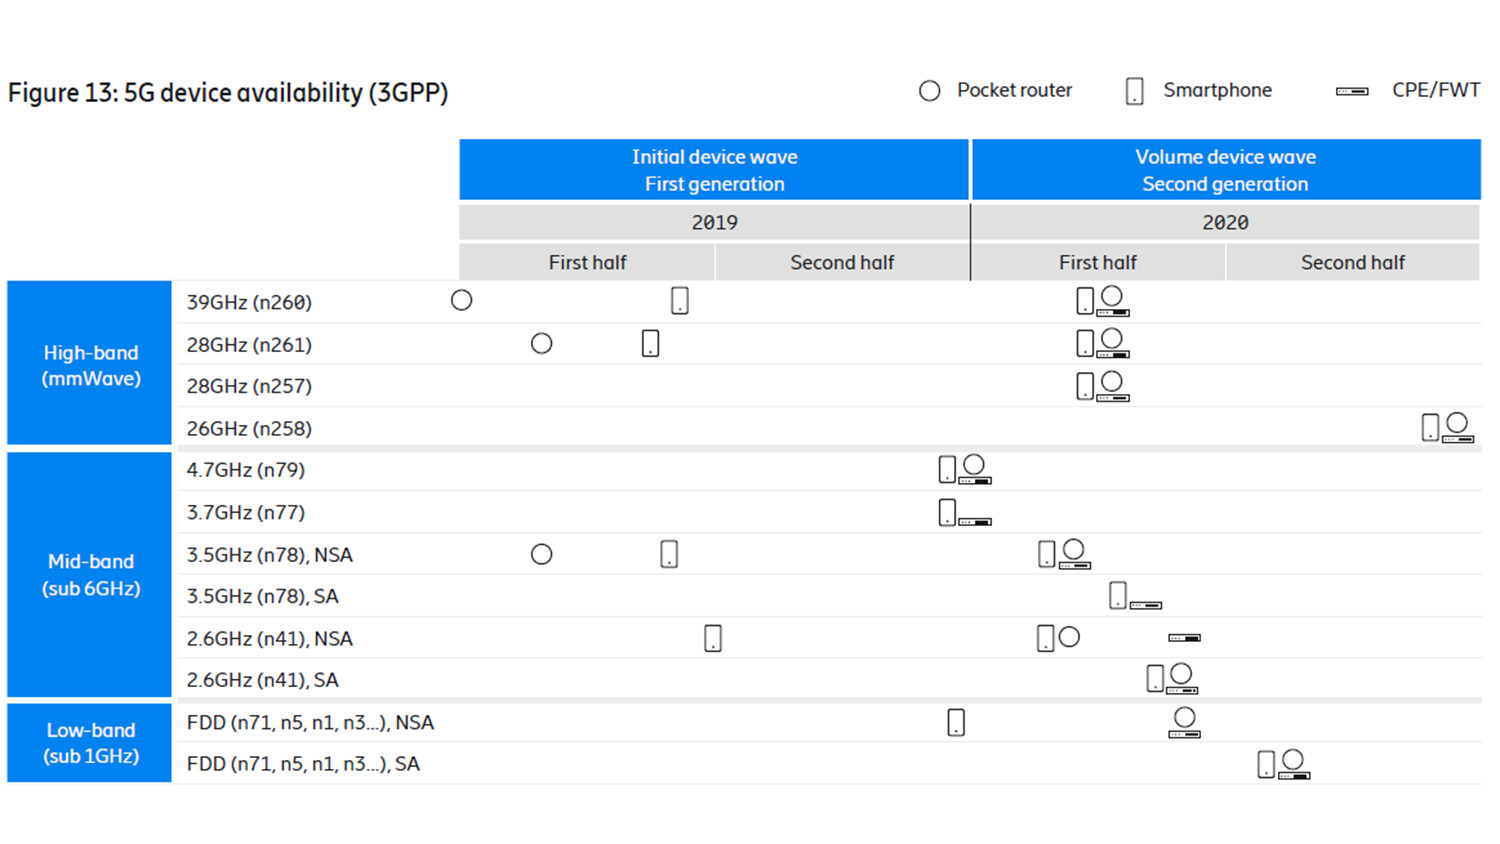
5G device outlook
Which spectrum bands, bandwidths, and features will devices support in the coming years? One example is that of New Radio (NR) high-band (mmWave)-capable devices, which drive high bandwidths in the network.
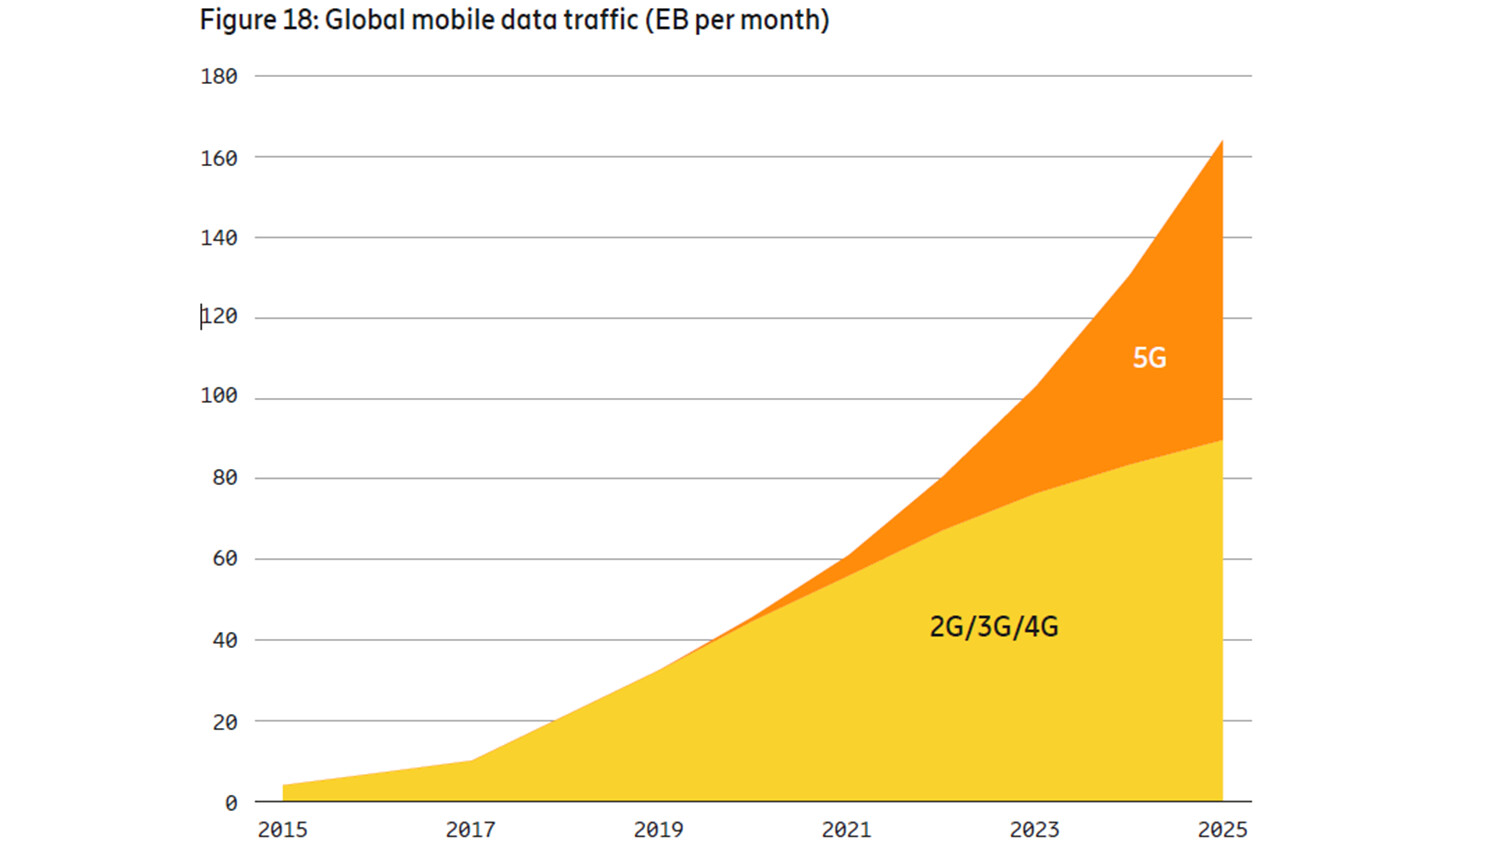
Mobile data outlook
This metric provides important information about the bandwidth that networks need to achieve. It is based on subscription-data volumes and numbers.
Ericsson Mobility Report also provides readers with a view of the speed of change in the mobile networks, which I find very helpful.
RAN deployment plans
Equally as important is understanding how communications service providers (CSPs) plan their radio access network (RAN) deployments. Variations between CSPs are significant. They depend on several factors:
- CSP spectrum assets
- CSP spectrum deployment plans
- CSP technology, i.e. 4G, 5G, and combinations thereof
- Regional market requirements
- CSP network architecture
I take into account the most advanced CSPs, with large spectrum assets, and CSPs on less advanced markets with less spectrum assets in the analysis. This provides me with useable numbers. In total, I use numbers from more than ten CSPs. If I use too few, or just one type of market, I would get an incorrect picture of the required backhaul capacities.
Ericsson RAN network technologies
We also need to look at Ericsson’s technology plans and developments. Products and solutions released to the market, along with the features they support, play important roles in shaping the networks.
There are several current and future technologies that affect the throughput achievable in a RAN network.
- Spectrum
Radios with large amounts of high-band spectrum enable extremely high throughput to end-user devices. - RAN features
Using advanced RAN features such as advanced RAN coordination (ARC), where multiple spectrum slots can be accessed by a single device (or user equipment, UE) at the same time. Also, very high modulation schemes will increase bandwidth.
Another important factor is the dimensioning model used for backhaul bandwidth. When I work with these tables, I assume a one-peak + two-average model for a three-sector end-site.
Creating the table
When I finally create the table, I take into account all the input above as well as last year’s numbers. I also typically remove the highest and lowest 5% to avoid outliers.
At the start of this work, looking for input that could give rise to large changes in the table, like the introduction of new spectrum, new RAN technologies, or other disruptive use patterns, is critical
I identified two key items for 2020:
- 5G deployment across different markets
Fast 5G deployment rates in early-adopter markets drive backhaul bandwidths. This is mainly due to the larger amount of spectrum assets available. - Deployment area differences
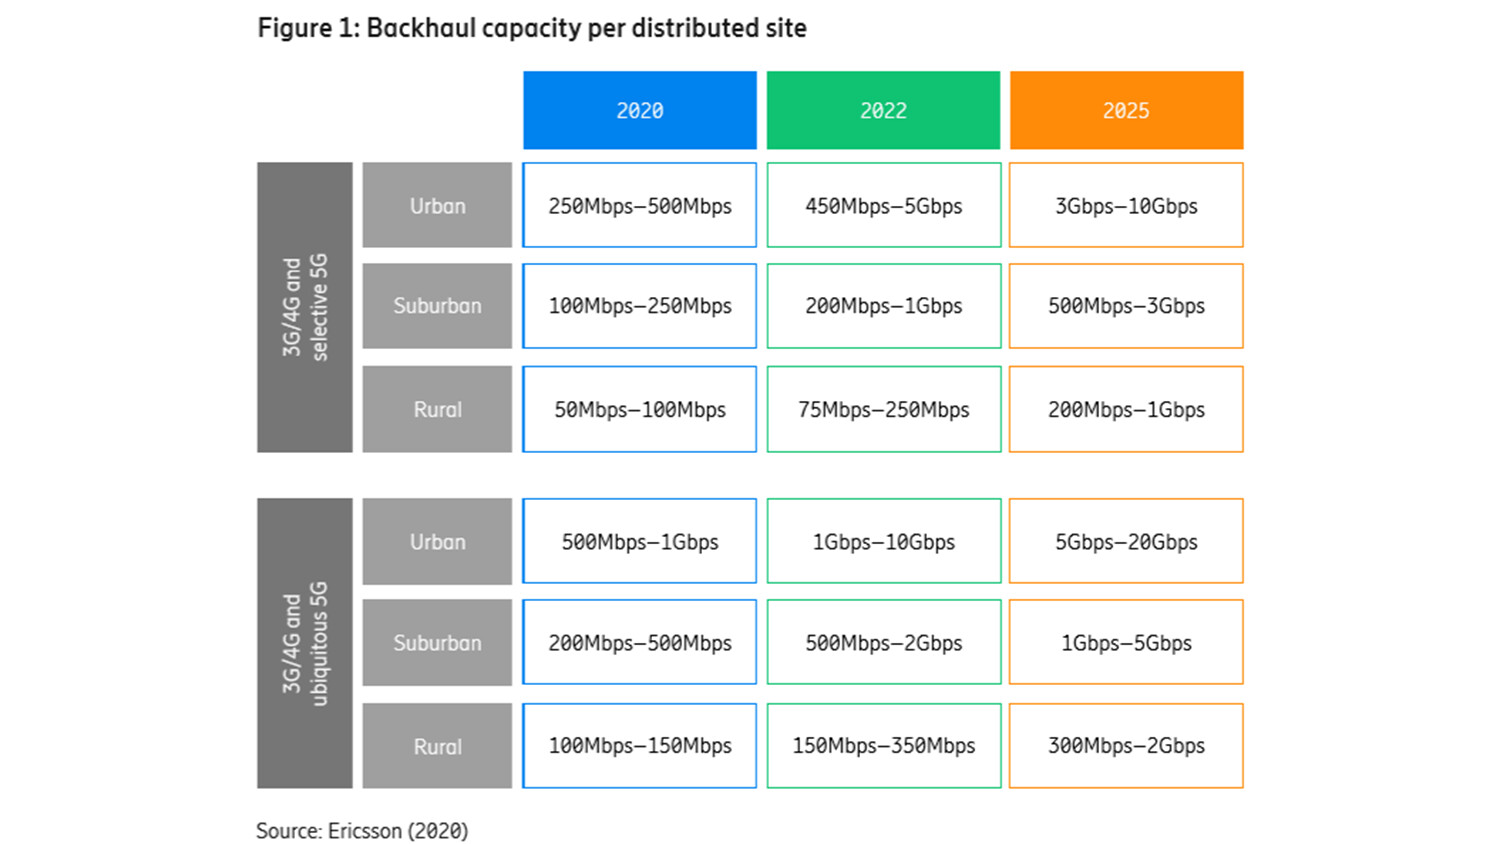
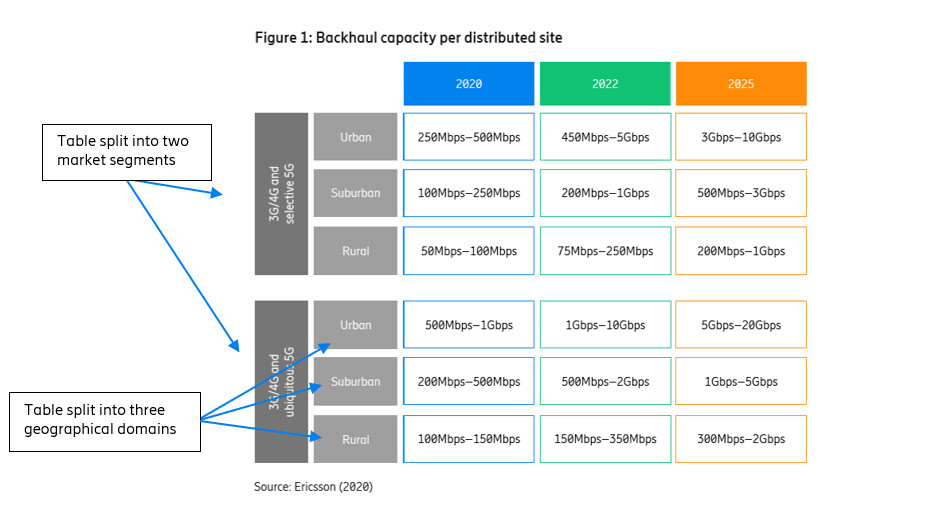
A sharp contrast between urban and other areas is emerging. This is largely due to planned deployment of dense small-cell networks and high-band spectrum in urban areas.
As a result, I split the table into ubiquitous and selective 5G, with ubiquitous reflecting early-adopter markets with fast 5G roll-out. Each sub-table is split into Urban, Suburban, and Rural areas to reflect the increasing differences.
Do we get it right?
The most common question I get is if our predictions are correct. Comparing all the tables we’ve produced since 2014, which is not that easy as the way we present the data has changed a bit over the years, I can say that the data is fairly consistent. There are only a couple of misses where we had to make larger adjustments for the following releases of the table. This, to me, indicates that the data collection methods we use are on track.
Reality then? Getting reliable field data is not easy but it does sound like a topic for a follow-up blog post.
Read more about our 5G Transport solutions