Machine learning use cases: how to design ML architectures for today’s telecom systems
Principal Engineer
Senior Data Science Manager
Machine Learning Engineer
Principal Engineer
Senior Data Science Manager
Machine Learning Engineer
Principal Engineer
Senior Data Science Manager
Machine Learning Engineer
There are numerous potential use cases for ML in telecommunications networks (see Figure 1).
In the area of system monitoring, anomaly detection systems are crucial for identifying performance issues and problematic network behavior. Proactively predicting the degradation of key performance indicators, and identifying the likely root cause, can help reduce and prevent outages.
In the area of managed services, ML models can improve trouble ticket management by effectively classifying, prioritizing, and escalating incidents. Capacity planning and customer retention can be improved through explainable churn prediction. Furthermore, in the area of intelligent networks, the incorporation of ML tools can enable self-healing radio networks, which automatically detect issues and take corrective actions. New technologies such as deep learning and reinforcement learning can be used to automate the network design process and optimize network performance in real time.
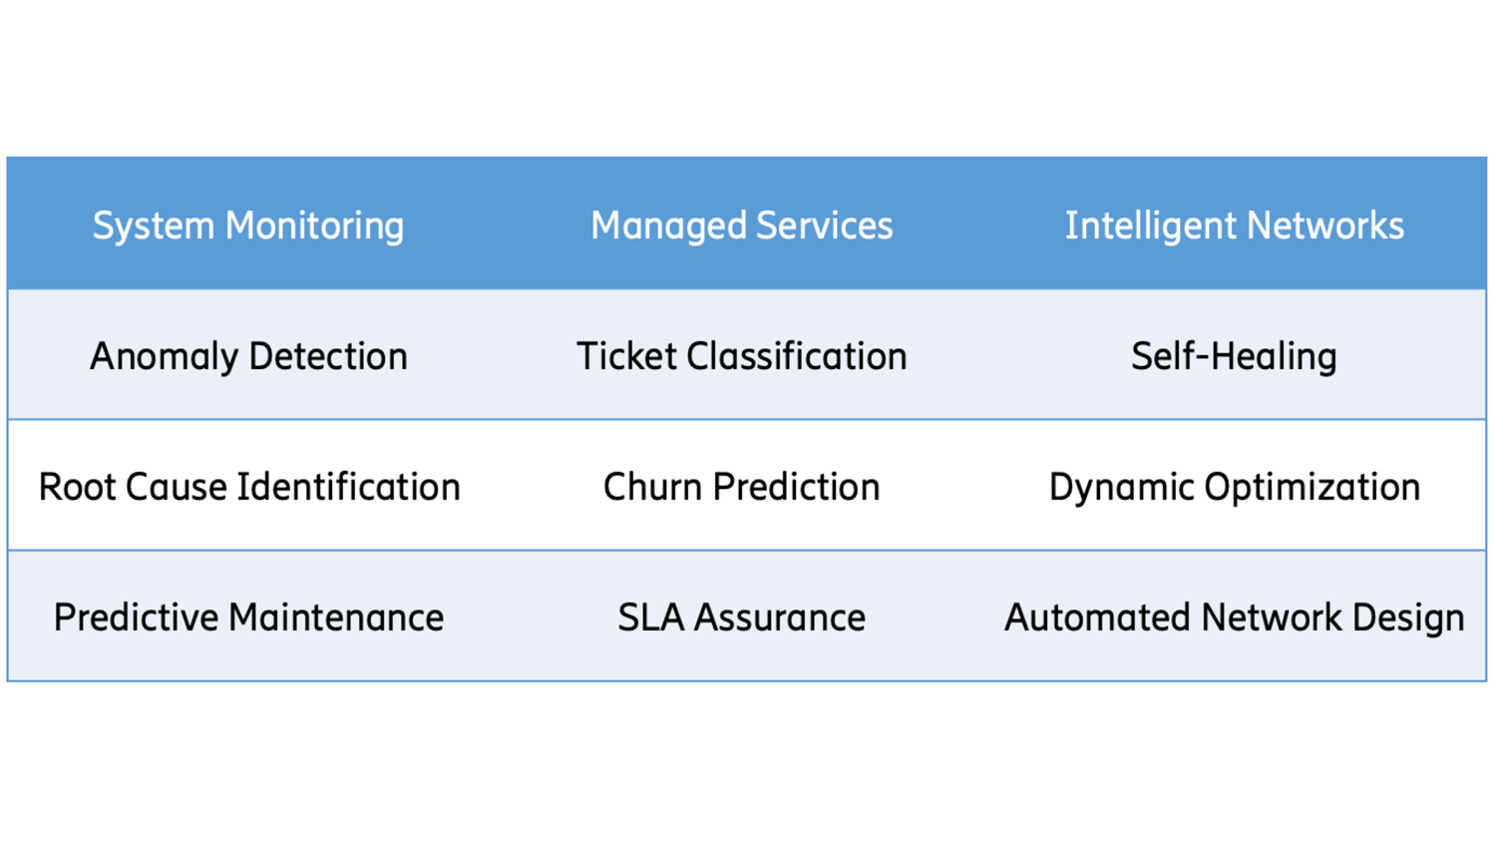
Figure 1: Common machine learning use cases in telecom.
Each of these use cases requires related but different ML models and system architecture, depending on their unique needs and environmental constraints. In this blog post we review common ML system components and their relationship to these different use cases. In subsequent blog posts, we will dig deeper into specific use case types and their unique needs.
Machine learning system components
Machine learning models exist within a complex ecosystem and depend on numerous services to function properly (see Figure 2). ML models may ingest data from simple user inputs, distributed databases, or streaming data pipelines. Some models have minimal storage requirements, but others depend on large, ML optimized data storage.
Across the end-to-end pipeline, data may need to be versioned, tracked, and validated. Similarly, multiple versions of ML models may need to be managed by a model registry and a model management workflow. To deploy models in various environments, teams choose from many different serving mechanisms and tools.
They also may use one or more workflow management tools to manage the entire end-to-end flow. The design of a suitable ML solution will have to address the use case requirements, the properties of the underlying data and conform to the underlying available computational and communication resources.
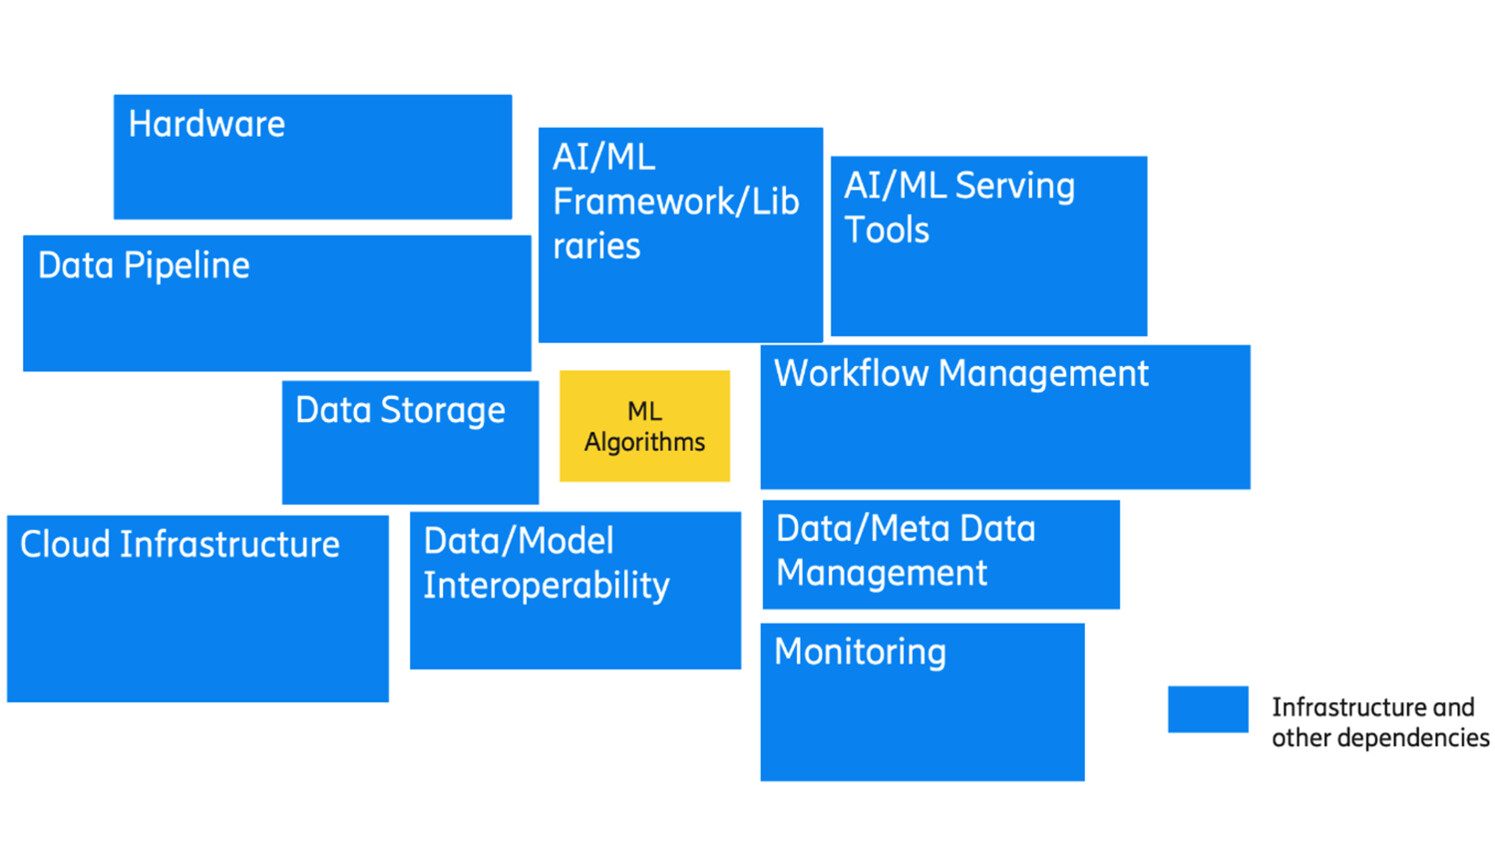
Figure 2: Infrastructure and other dependencies to support ML models.
The components of an ML solution can be viewed as a layered structure of support for ML applications (see Figure 3). The compute requirements of a model can range from general CPUs, GPUs to specialized hardware (such as ASIC, FPGA, sometimes enhanced by hardware accelerators). Modern cloud infrastructure has made the general compute resources highly accessible via scalable, on-demand services. However, in the context of distributed edge networks where specialized hardware is often used, certain computational needs can pose additional challenges.
Cloud native ML workloads are commonly deployed as container-based microservices, and their infrastructure footprint can range from a single node running Docker to a cluster of nodes managed by a container orchestration system, such as Kubernetes. At the distributed edge, however, resources may be more limited and cloud native deployment strategies may not be appropriate.
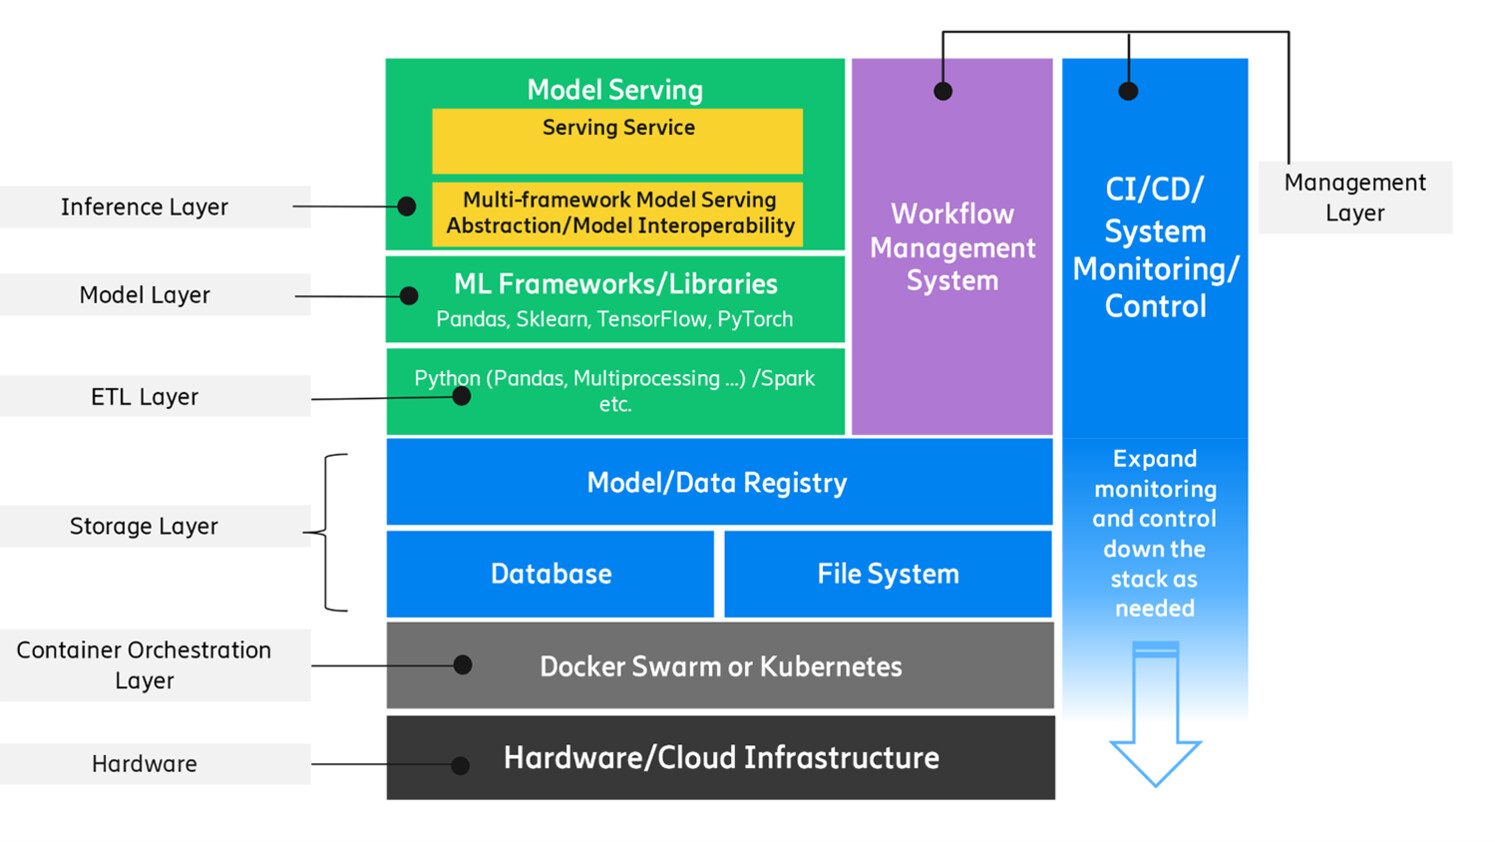
Figure 3: Layered dependency structure to support ML models
To ensure ML models perform as expected, workflow management tools are often used to drive the end-to-end lifecycle. These workflow management tools can be used to design, schedule and monitor actions such as data ingestion, preprocessing, model training, and inference.
During the data ingestion step, Extraction, Transformation, and Loading (ETL) steps are performed to collect data, transform it, and load it into a data store. Data may then need to be further validated, cleaned and processed into a suitable format for the model to consume. Over the course of their lifetime, models will likely need to be retrained due to model performance degradation or distribution drift, and this can be accomplished manually or in an automated fashion. Finally, to ensure that model execution is consistent and scalable, an ML solution will often incorporate a specialized inference service.
Data collection and monitoring components
Data is the lifeline of any ML system. Telecom data is complex, multi-modal, and plentiful, comprising numerical metrics and text-based logs collected from many thousands of devices. The computational and communication costs of processing the data, as well as the latency and performance requirements, determines how the data components should be designed and implemented.
Since ML models strongly depend on data, the data needs to be carefully tracked and managed. Minor data schema or quality changes can significantly affect ML model accuracy. Therefore, data provenance and lineage should be versioned and tracked, and data quality should be assessed and validated. The data and associated metadata should also be carefully maintained over time since system modifications, such as changes in upstream data pipelines and software packages, can affect how ML models work.

Read more: machine learning systems
Here’s how you can develop monitoring tools to proactively maintain high-quality, high-availability ML systems in modern networks.
Click hereModel registry
Model registries are used to track the specific versions of model weights, parameters and code during the course of a ML system’s lifecycle. During deployment, models may be retrained on newer data, hyperparameters may be optimized based on new metrics and code may be updated to improve performance. Careful tracking and logging assists in identifying the root cause of performance issues and building reliable and reproducible end-to-end data pipelines.
A number of open-source model registry tools are available. A commonly used tool is MLflow, a library-agnostic system that can be used to track the results and artifacts associated with ML experiments, as well as store and manage serialized models. Due to the high dependence of ML models on the entire end-to-end pipeline, and the need for data provenance and tracking, other tools such as ModelDB and Tensorflow Extended can be configured to track ML data and models across large deployments that incorporate numerous distributed data sources.
Model serving
Model serving frameworks exist to reliably provide responses to prediction requests. As part of this work, they provide a unified and predictable interface that abstracts away the details of a model’s underlying inference pipeline. Popular open-source frameworks for model serving include Seldon Core and KF Serving, which operate within the microservice paradigm on top of Kubernetes. More specialized frameworks also exist, such as TF Serving for the TensorFlow ecosystem.
To meet the needs of production deployment, serving frameworks provide standard ways of addressing scalability, often by relying on the features of an underlying orchestration system. Inside the model serving component, there may be a subsystem for routing inference requests to different model versions to assess relative accuracy or performance (i.e. A/B or shadow testing), as well as a subsystem for logging performance metrics.
When models are deployed as independent microservices that accept requests, the execution speed of each request can become a performance bottleneck. During the initial model development phase, models may be suboptimal, existing in prototypical form for easy experimentation. Later, a model may need to be optimized for rapid execution performance before being deployed to production.
Offline vs. online predictions
Machine learning predictions can be made in either periodically scheduled batches (offline), or in a dynamic streaming manner in real time (online). Batch prediction may be suitable when some delay is acceptable. In batch prediction, model prediction requests are accumulated over time, and the model responds to each batch of requests at an appropriate, predetermined time. The results of a batch run are often written to an intermediate location, where they can be consumed later as needed. For example, certain network anomalies may only need to be detected on a daily basis and some delay in alerting may be tolerable. An advantage of the batch prediction approach is that it can reduce overhead compared to handling each request individually, which can potentially resource requirements compared to streaming real time predictions.
For mission-critical tasks such as predicting service outages, however, real-time predictions may be required. In this mode of operation, the ML model service immediately returns a prediction output upon receiving input data. This execution mode can have challenging requirements from an operational standpoint. Because real-time prediction may need to support a large and unpredictable number of requests, the model service may need to scale dynamically and provision more resources at peak request times. Also, the service may benefit from self-recovery mechanisms in the case of response delays or service failures. These needs require the implementation of additional systems to monitor reliability and availability and respond accordingly.
Some use cases will work with very large amounts of data that require substantial compute resources to process. Other use cases will depend on fast query responses to enable low latency predictions. For these scenarios, hybrid processing approaches, such as Lambda or Kappa architectures, can help achieve low latency, high throughput, and fault tolerance. These architectures provide a combination of real-time stream processing for low latency applications and batch processing for working with larger amounts of data.
Workflow management
To orchestrate the entire end-to-end ML pipeline, workflow management tools can help immensely. An ML pipeline consists of a number of inter-dependent tasks including data collection, transformation, validation, training, and serving. Workflow management tools can help effectively chain these tasks together, such that unexpected delays or issues in one step do not break subsequent steps.
For example, data collection may be performed in a periodic manner. If there is an unexpected delay in data arrival, subsequent steps may need to wait. Executing on a schedule that doesn’t have an awareness of each step could cause unexpected errors. Workflow management tools such as Airflow can be used to orchestrate interdependent tasks and help pass data between tasks. They can also be used to implement complex logic in scenarios such as model retraining and deployment.
In the modern containerized microservice paradigm, each component that supports an ML model may execute inside its own containerized environment. Kubeflow was developed to manage the ML lifecycle in such an environment, where the data collection, model training and model inference components exist within separate pods in a Kubernetes cluster.
CI/CD, system monitoring and control
Since an ML solution is a deployed set of services that run together as a system, ML teams will benefit from adopting system administration best practices. These could include techniques such as CI/CD, monitoring, visualization and alerting.
Like any software project, an ML project can use a Continuous Integration (CI) pipeline to run a set of tests upon each code commit to ensure that the code remains functional when each change is merged. It can also use Continuous Deployment (CD) to automatically build artifacts and deploy them to the production environment when merging new changes. These techniques can keep an ML project consistent as changes are made over time, and help teams detect bugs as early as possible in the software development process.
A monitoring system should be configured to monitor each deployed service, measuring both health (“is the service responding?”) and performance (“is the service keeping up with demand?”). Monitoring can focus on a couple of key metrics such as queue depth and response time, or it can collect more detailed information for troubleshooting purposes. Monitoring should be extended down the stack according to the team’s area of responsibility—in other words, if a team is responsible for a particular component, then that team should monitor that component.
Experienced system administrators monitor their dependencies as well as their services, and teams may find it helpful to extend their own monitoring in a similar fashion, especially for infrastructure dependencies such as networking and storage.
Visualizing monitored metrics can be helpful for ML teams as well as their stakeholders, and can help provide a sense of how well the solution is performing over time. There are many open source monitoring tools that integrate visualization tools (for example, Prometheus/Grafana), and many of those tools also have features to send alerts when metrics go out of a specific range or patterns. Along with visualizations, teams could choose to expose a control surface to their users to enable manual actions, such as model management.
Summary
ML solutions are complex systems comprised of several components that may differ from the existing infrastructure organizations have in place. Depending on the particular use case, each of these sub-components may be implemented in a different manner. In future blog posts we will delve into more details about these use cases, and how they take can advantage of different ML components covered in this article to achieve specific business objectives.
Acknowledgements
In writing this post, I would like to thank Xuancheng Fan, Kunal Rajan Deshmukh, David Stone, and Zhaoji Huang for their contributions in related work, and Zeljka Lemaster for proof reading and revision suggestions.
Learn more
How to build robust anomaly detectors with machine learning.
Here’s an introduction to machine reasoning in networks.
Read more about AI in telecom networks.
Read more about CI/CD.