








Wind load. It slows you down, costs you millions, and it's all make-believe.
- Independent testing shows that reported passive antenna wind load figures can vary dramatically depending on the test tunnel, meaning CSPs may be making multi-million-dollar infrastructure decisions based on data that is not truly comparable.
- With audited and field-validated wind load data, operators can unlock major savings, speed up deployments, and make more confident structural decisions.

Dipl. Ing. Head of Sales Innovation & Technical Sales Support

Master Developer Aerodynamics | Wind Load Specialist | Mobile Communication Antennas

Developer | Mechanical Engineer | Mobile Communication Antennas
Dipl. Ing. Head of Sales Innovation & Technical Sales Support
Master Developer Aerodynamics | Wind Load Specialist | Mobile Communication Antennas
Developer | Mechanical Engineer | Mobile Communication Antennas
Dipl. Ing. Head of Sales Innovation & Technical Sales Support
Master Developer Aerodynamics | Wind Load Specialist | Mobile Communication Antennas
Developer | Mechanical Engineer | Mobile Communication Antennas
The telecoms industry spends $17.5 billion every year on tower infrastructure. Communication service providers (CSPs) carry 95 percent of that cost. At best, this represents 2 percent of the average revenue per user (ARPU), at worst 6 percent. This is an investment decision that up until now has been made completely in the dark, without any way of knowing if you are overspending or underspending.
The hunt that became an investigation
At Ericsson, we have spent the past decade reinventing how to reduce wind load, releasing industry firsts like vortex generators that lower antenna wind load by 20 percent, refining radome shapes to improve aerodynamics, and constantly seeking every opportunity to shave off weight. That made it all the more shocking that competitors were still reporting lower wind load numbers than us.
No vortex generators. Standard brick shapes. Heavier equipment. Three things that in theory should make it impossible to compete on the same level. Yet year after year, the same wind load numbers were reported. Year after year, it appeared as though we were playing catch up.
So we decided to do something different. Rather than only running our latest radome shape through our standard wind tunnel, we decided to test it in two additional tunnels.
The results were materially different.
Across three facilities: Technische Universität (TU) Dresden in Germany, Politecnico di Milano in Italy, and a university in Southern China, the recorded wind load values for the exact same antenna diverged by as much as 12 percent.
All three tests were conducted in compliance with NGMN BASTA. All three results were, technically, valid.
This reframed the entire problem. If the same antenna produced different results depending on which tunnel it entered, then the tunnel was doing more to determine the outcome than the antenna itself. Any comparison made across different tunnels was, by extension, not a comparison of antennas at all.
Calling in the independent auditor
To test that suspicion properly, the only meaningful experiment was the inverse: hold the tunnel constant and vary the antennas. Take competing products into the same facility, on the same day, with the same team, and see how they would hold up against each other under identical conditions.
To remove our own bias from the result, we handed the test to TÜV SÜD, one of the world's most trusted technical testing and certification bodies. Antennas from four vendors, tested in the same tunnel at TU Dresden, using the same calculations and the same standards throughout.
All competitor antennas showed discrepancies between their published data sheet values and the aerodynamic force measured under the TÜV SÜD audit, in some cases . The wind load figures CSPs and tower companies have been relying on to make structural and commercial decisions did not reflect what happens when wind hits the antenna.
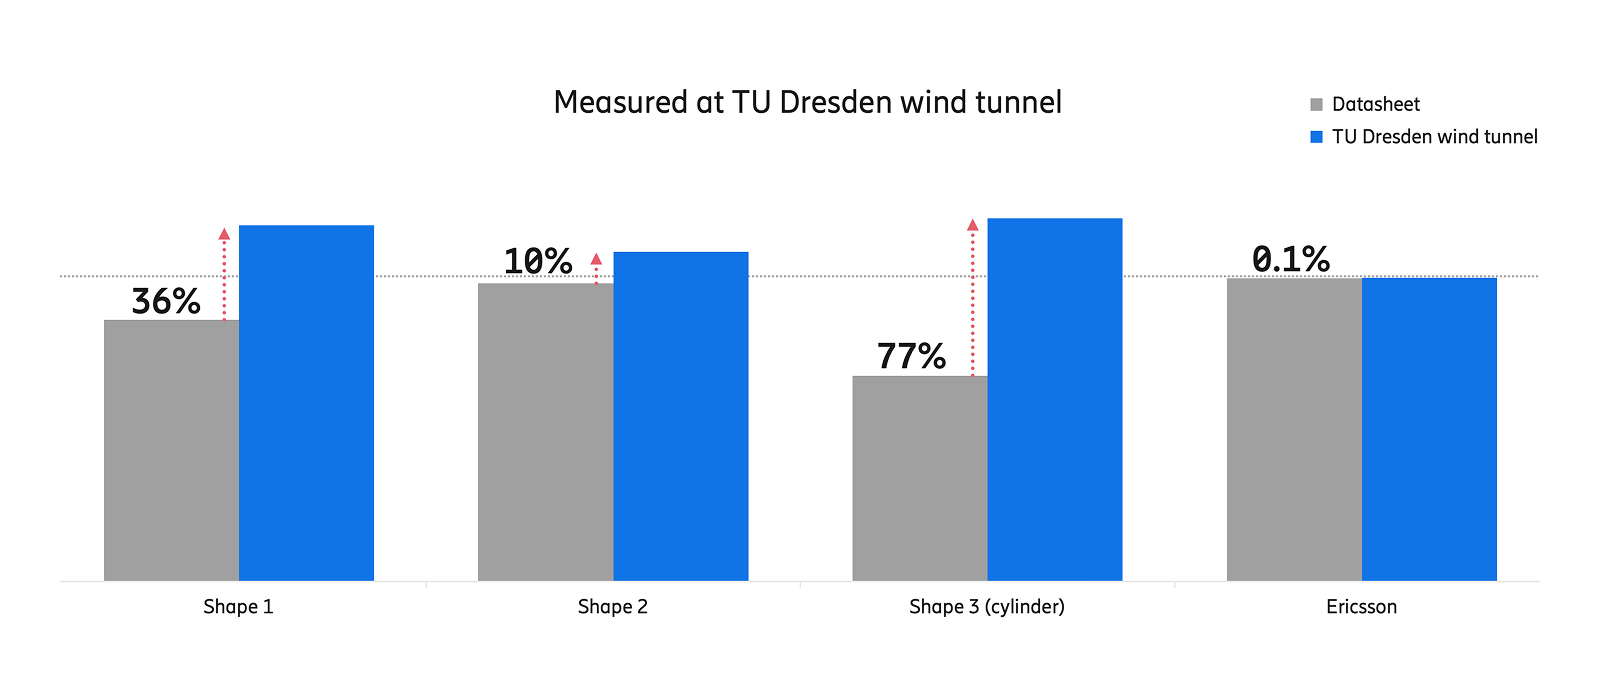
Independent TUEV SUED wind load audit reveals major gaps between published antenna data sheet values and measured aerodynamic force
Vendors who report thoroughly calculated wind load values will appear to have less aerodynamic antennas. Vendors who use more optimistic measurements, whether through tunnel selection or methodology, will look more attractive in a bid. The market has been rewarding imprecision, making it impossible to use wind load figures as a meaningful basis for comparison.
Why the standard allows this to happen
At this point, a fair question arises: aren't all vendors following the same standard? The answer is yes, and that is precisely the problem.
NGMN BASTA establishes a common framework for wind load reporting, introducing polar plots of resultant force measured at 10-degree increments at 150 km/h. But the framework governs what is measured, not how the measurement is produced.
Under BASTA, turbulence intensity can vary between facilities. Each tunnel decides its own algorithm for blockage and wall interference corrections. Mounting rig design is left to the vendor. Wind speed tolerances are wide. Tunnel size and type, open or closed, are both accepted without normalization.
Every one of these variables requires a correction or an assumption before a final wind load figure can be reported. And every correction introduces a degree of freedom. Think of it like mechanical tolerances: the more components that are allowed to move independently, the more points at which error can accumulate. BASTA, as written, allows major variables to move at once.
The consequence is that two telecom tunnels running the same test will produce different results. A vendor can, in good conscience, select the testing facility that produces the most favorable results for a given antenna design.
Putting our own methodology on trial
We anticipated the natural objection: could we ourselves be selecting a favorable tunnel? Is Dresden simply the facility that happens to produce better results for our antenna geometry?
To settle that, we went outside. 12 months ago, we installed one of our antennas on the Norwegian coast, 400 meters above sea level on a clifftop with nothing but the Atlantic Ocean in front of it. The antenna was fitted with 11 sensors tracking wind direction and structural load across every axis.
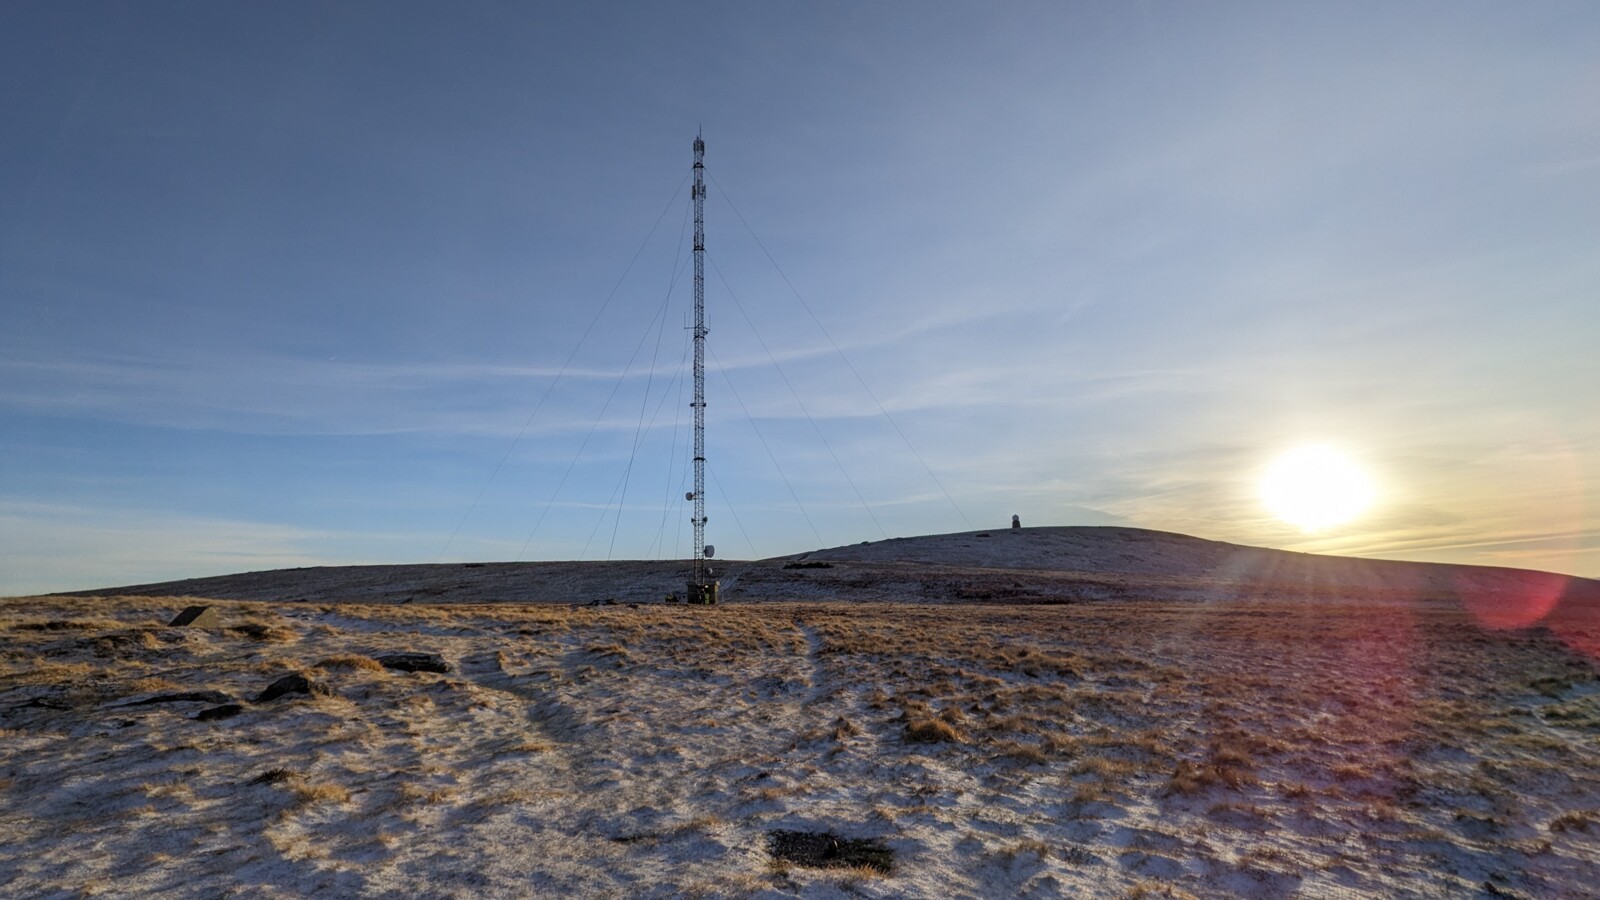
Ericsson coastal field test site in Norway used to validate antenna wind load performance under real-world high-wind conditions
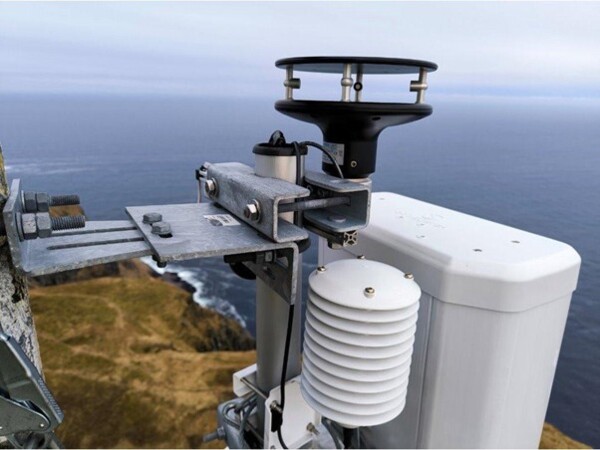
Sensor-equipped Ericsson antenna measuring structural load and wind direction to verify real-world aerodynamic performance
Over 356 days of continuous measurement, the site delivered conditions no controlled facility can replicate: maximum sustained wind speeds of 243 km/h, approximately 31 hours equivalent to a Category 1 hurricane, and over 980 hours of tropical storm-force winds.
The question was whether the aerodynamic forces recorded in Dresden would hold up across the full range of conditions the site produced, not just at peak wind speeds but across the hurricane, tropical storm, and less than tropical storm wind regimes that represent the everyday structural reality of an antenna in service.
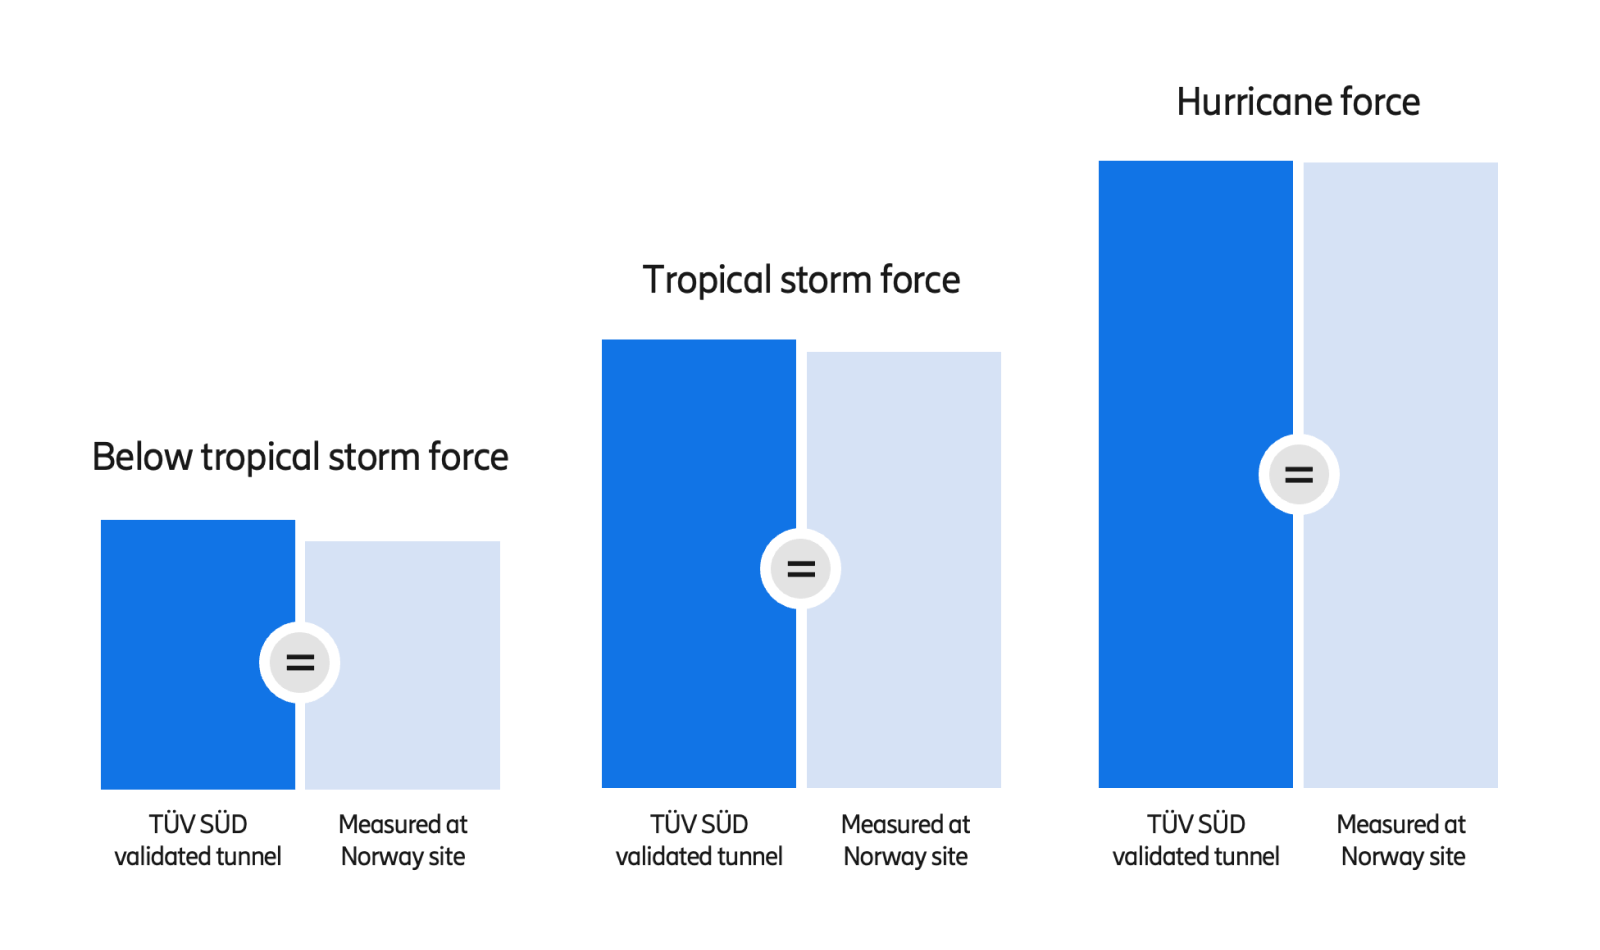
Field measurements show 95 percent alignment with TU Dresden wind tunnel predictions across tropical storm and hurricane wind regimes
Across all three regimes, the field measurements tracked the Dresden predictions with 95 percent alignment. The tunnel accurately models the antenna's aerodynamic behavior across the full range a structure will experience in service.
Four ways this is already costing you money
Tower rental fees are the most immediate place to look. Because tower companies (TowerCos) do not trust vendor-reported wind load values, they default to antenna dimensions when calculating rent, disregarding the aerodynamic force an antenna exerts on the structure. It is a proxy for a number they do not believe, and CSPs pay for that distrust. With validated wind load data, billing can shift to reflect actual structural stress, and Ericsson's internal analysis suggests this shift can deliver up to 20 percent opex savings on rental fees alone.
The steel question is less visible, but the numbers are just as significant. Structural calculations governed by EURO Code (EN 1991-1-4) treat antennas and blunt bodies as high-drag elements with no regards to wind load. The result is over-specified steelwork, safety buffers that made sense for equipment no longer being deployed, that increases capex by 10 to 15 percent with no corresponding structural benefit.
Deployment speed compounds the problem. TowerCos regularly declare sites as structurally full based on those same conservative static calculations. Verified wind load data tells a different story: many existing masts can safely support three to five times their currently permitted loading, and every site needlessly declared full is a delayed rollout, and thus delayed revenue.
Structural risk cuts the other way. NGMN BASTA already permits CSPs to reduce safety buffers when wind load data is provided. If a CSP applies that allowance using optimistic competitor data, data that our independent audit found may underreport real aerodynamic forces by half, they may be operating infrastructure that is structurally under-dimensioned.
So what can you do right now?
Don't rely on data sheets alone. Before any wind load figure informs a structural or commercial decision, ask whether the methodology behind it has been independently audited or verified against real-world measurements.
The TÜV SÜD report we co-produced is a starting point.
We are also working on a longer-term proposal that would give every vendor a common measurement baseline, removing tunnel bias from the equation entirely. We explain more insights with our recent technology paper "Industry challenge: Wind load of base station antennas".
Insight our technology paper
Discover the important world of wind load more and unlock the secrets of validated values of base station antennas! Read our latest paper now and gain invaluable insights into this underrated topic.
Get the paper