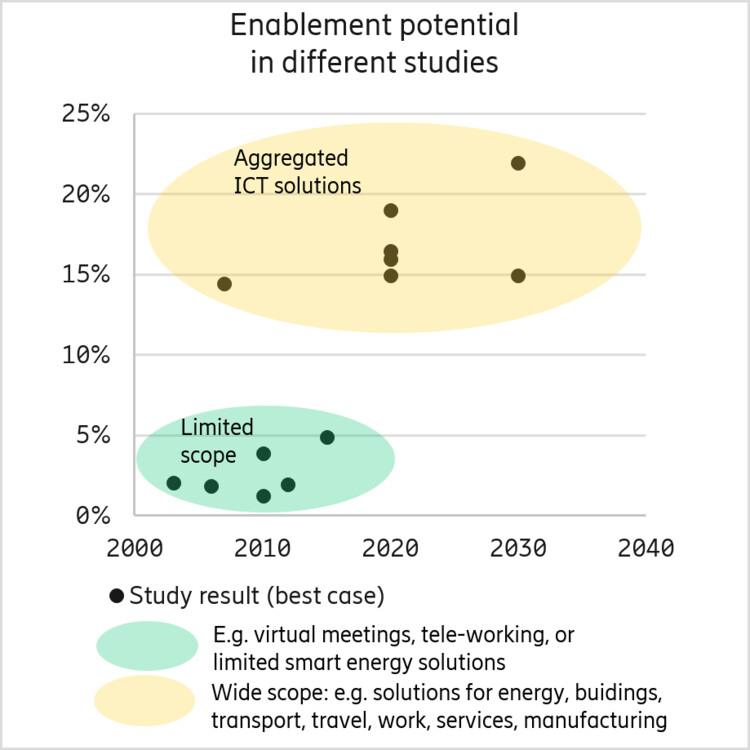
| Scope |
(Year) |
Enablement potential |
| World 2030 |
(2008) |
22%,
Worst scenario: only 3% |
| EU 2020 vs 2000 |
(2010) |
19%
Worst scenario: increased emissions by 1,6% |
| World 2020 |
(2012) |
16,5% |
| EU 2010 vs 2000 |
(2004) |
16%
Worst scenario: increased emissions by 1,8% |
| World 2020 |
(2008) |
15% |
| World 2030 |
(2015) |
15% |
| Korea 2020 |
(2013) |
14,5% |
| Australia 2015 |
(2007) |
4,9% |
| Japan 2010 |
(2008) |
3,9% |
| US & Japan 2003 |
(2003) |
2,1%
Worst scenario: increased emissions by 0,8% |
| US & EU 2012 |
(2012) |
2% |
| Japan 2006 |
(2003) |
1,9% |
| EU25 2010 |
(2006) |
1,30% |
The large variation depends on factors such as the geographical scope of the study, the type of ICT solutions included and the estimated future total emissions in a business-as-usual scenario without the solution. Further differences include the estimated uptake of a solution, assumptions of the reduction potential and the inclusion of emissions from the ICT solution itself. In some studies, an identified reduction potential may be outnumbered by an expected increase in greenhouse gases due to other growth factors.
Boundaries are essential
When performing and presenting the enabling potential of ICT solutions, boundaries are essential to the overall result. Geographical boundaries must be set and understood so that the results can be scaled accurately. Using a usage perspective – only considering emissions associated with the geographical area where the product is used – will give essentially different results compared to using a life cycle perspective including all impacts from cradle to grave. Preferably a life cycle perspective should be used, though it may be difficult to fully implement.
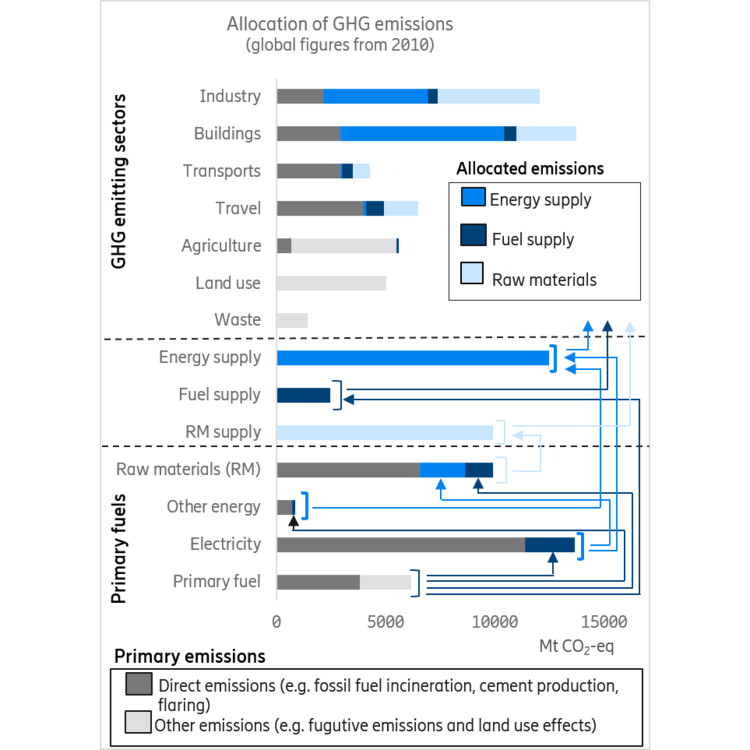
Also, the life cycle impact of the ICT solution itself – both from production and usage, should be considered – and not only its impacts in other sectors. The boundaries applied for the ICT solutions will influence the results. Life cycle emissions from raw materials, fuel and supply need to be considered. The impact from these basic resources are to be allocated to the main GHG emission sectors: industry, buildings, transports, travel, agriculture, land use and waste, as shown in the figure below.
Which reductions are due to ICT solutions?
Most activities of modern society make use of ICT solutions in some way and ICT include a wide range of technical solutions. However, caution is needed when claiming potential reductions as ICT reductions. For example, built-in electronics used in motor optimization not relying on communication for its reducing effect should not be classified as an ICT solution.
The ICT solutions for which a reduction in carbon emission is claimed should by themselves reduce the emissions, like videoconferencing enabling a potential reduction in travelling. IT solutions with monitoring, administrative or other supporting roles should be left out from estimates of ICT´s enablement potential.
Risk for double-counting
Many ICT solutions will contribute to reductions of carbon emissions and thereby to the total reduction of the business-as-usual scenario. Overlapping effects might occur between solutions as different ICT solutions target reductions of the same emissions. Such overlaps need to be handled in any study to avoid double counting.
Understanding addressable emissions
A credible baseline scenario needs to be estimated with enough details to set the addressable emissions for different solutions. Detailed knowledge about distribution of impacts between industry sectors and the historical impact trends are required. Also, when reusing data between regions, existing implementations of similar ICT solutions and differences in conditions need careful consideration before transferring case-specific data. For this task, data from acknowledged official sources should be used. Often such data need recalculation as they may not be categorized or detailed in a way that is useful to understand addressable emissions for specific sources.
Ericsson’s approach for allocating overall emissions – an example
Based on acknowledged data sources, global GHG emissions are divided into direct emissions like fossil fuel incineration, cement production and flaring and other emissions like fugitive emissions and land-use effects.