How can AI reduce time spent on categorizing CSPs’ financial data?
Senior data scientist
Senior AI Technical Product Manager
Sai is a senior data scientist at Ericsson Global AI Accelerator in Bangalore, India.
Director, Data Science
Head of Innovation & AI for Managed Services (MS) for North America in Ericsson
AI Innovation Director for Managed Services (IT&ADM) globally in Ericsson
The categorization of variance in financial transactions is one of the crucial problems for telecom Business Support System (BSS).
For example, communications service providers (CSPs) in a country like the United States typically deal with millions of financial transactions from customers each month. Among those millions of transactions, some billing disputes or financial variances are to be expected. The latter occurs when the actual and expected amount of billing for a given customer differs. A typical CSP in the US can see up to one thousand transactions flagged as variances or disputes daily. These variances or disputes may have different causes, such as inter-carrier traffic, fraud, customers traveling across time zones, the date or time fields changing due to daylight saving times, or an error in one of the financial systems. In a use case related to a tier 1 CSP in the US, a rule-based automated reconciliation process runs daily to categorize the variances and disputes.
An example of an error causing the financial variance is as follows: a telecom customer does a top-up or refill into their prepaid account from a point of sale or a shop. The amount of top up is sent to the order management system of the service provider, which then updates the customer’s balance in the charging system by adding the refill amount. It then creates a transaction record against that customer in the billing system. After these steps are done, the status (success or failure) is updated to the point of sale. But if any of these steps fails, for example the charging system is updated correctly but the payment transaction record is not created in the billing system, then a financial variance is created.
Although the rule-based automated process speeds up the financial variance reconciliation that would otherwise be carried out manually, they still face a variety of issues. For example, up to a quarter of the variances observed in one day may not be properly categorized due to changing definitions of a financial variance or because a new kind of variance occurred. Those variances without a proper categorization need to be reconciled manually. Some of the known variances may also become redundant over time, as rules are modified to fix some of the known issues.
Categorizing and resolving the variances that are not automatically reconciliated may take around 15-20 minutes per issue, and identifying a new category of financial transaction might take several hours.
Solutions based on machine learning models have the potential to drastically reduce the time service providers spend resolving the financial variance, and automatically identifying new categories of financial transactions.

Advantages of ML for categorizing financial variance
There are several advantages of using a Machine Learning (ML) system for categorizing the variances in the financial telecom data:
- ML systems can work with incorrect or missing data, which is often the case in production deployments
- A ML system can categorize with accuracies that are on a par with a static rule-based system for existing labels. The additional benefit of a ML-based solution is that it will identify new categories from the data itself and learn new labels without any additional manual rule specification. A rule-based system will require coding and maintenance efforts for every new data pattern identified manually.
- If the nature of the financial data changes over time, a model just needs to be periodically retrained with the new data. This retraining is faster and likely more accurate than manually checking to identify if new categories are needed for the changing data.
- Visualization of ML modeling outcomes can help to identify similarities between different data points, and define clusters based on those similarities. This could be useful in cases where data labels are not available, or where one needs to understand why a data point is categorized in a certain way.
- Using explainable AI tools, one can interpret why a specific data point was categorized in a certain way.
Our ML solution
Together with our partners from MSIT and other business divisions, business associates and subject matter experts (SMEs), Ericsson Global Artificial Intelligence Accelerator (GAIA) has developed a ML solution trained on historical data that categorizes the financial variances through the following steps:
- A supervised learning algorithm trained on historical data classifies the financial transactions into one of the known categories.
- A clustering algorithm assigns the unresolved variances to the closest category.
- A separate clustering algorithm proposes new clusters when unresolved variances are not similar enough to one of the existing categories. The new cluster(s) are then validated by the subject matter experts on the CSP side.

Access Ericsson Technology Review
ETR brings you insights into some of the key emerging innovations that are shaping the future of ICT. Read the latest articles from our experts.
Click here
Preprocessing and feature engineering
Initially, we had more than 200 features in the joined table sourced from the input financial tables. After consulting with SMEs to identify important features and perform some preprocessing steps, we brought the number of features down to about 30. Our preprocessing steps included taking out the features that mostly contained nulls, taking out non-numerical and non-categorical features such as IDs and address-related features (which are irrelevant to the classification), correlation analysis to get rid of duplicate or correlated features and so on. We used a standard scaler to scale the features.
A brief description of the main ML algorithms used in our solution is as follows:
Supervised learning: Supervised learning consists of two steps: training and prediction. In the training step, we split the data into train and test sets. We fit an ML model to the train set, manipulating the hyperparameters of the model until the desired accuracy is obtained. This trained model is then tested on the test data to verify how accurate it is. Once trained, the model is used to predict the category labels for the new incoming data. Tree-based models offer a good trade-off between accuracy and speed for model fitting. Among those models, LightGBM has recently emerged as a good performing algorithm.
In our case, we used an ensemble model consisting of lightGBM, a variant of lightGBM with focal loss and xgboost for our supervised learning step, using a majority rule to decide the output class. We chose these models since they are quick to run and provided the best accuracy for the data we had. We determined the confidence of the ML model categorization for each data point and used an empirically determined threshold, below which we used clustering.
One problem we found with some of the less frequently occurring categories was a lack of training data. For this, we performed data balancing using Synthetic Minority Over-sampling Technique (SMOTE) and some similar algorithms. For less frequent categories we used a hybrid of a rule-based and supervised approach, where we leveraged the knowledge from the SME to categorize the data using rules, which was then used to train the supervised ML model.
We obtained an overall accuracy of around 85 percent in the categorization of the financial variance using our supervised ML model for known categories, and about 50 percent for the new categories after we removed the features that were generated by the rule-based automated process used currently.
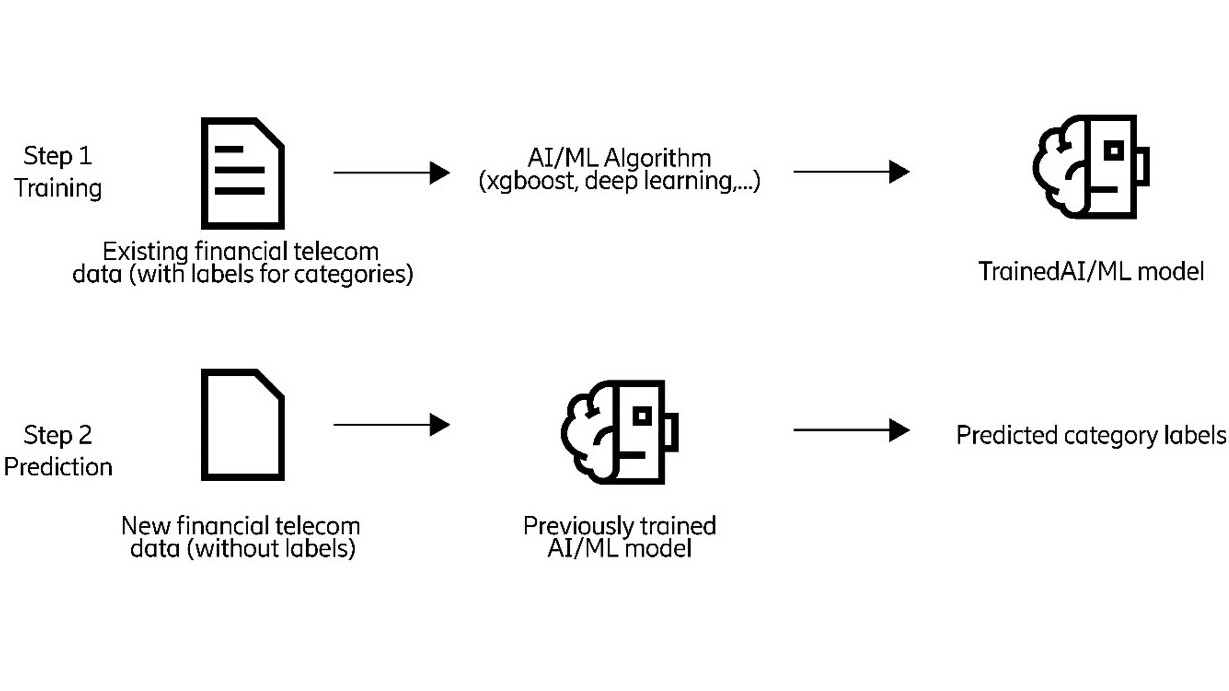
Figure 1: An illustration of supervised machine learning to predict the category labels for the financial data.
Clustering: Common clustering algorithms include K-means, density-based spatial clustering of applications with noise (DBSCAN), gaussian mixture models or hierarchical clustering, to determine whether the data falls into clusters. The aim is to group similar kinds of financial data into the same cluster, which can be then given the same category label. It’s therefore necessary to map the identified clusters, obtained from the clustering algorithm, with the known category labels.
In our case, we ran the clustering model on those transactions that could not be classified by the supervised model used in the previous step. We used the same set of features for the supervised learning and clustering steps. We used the Elbow method to estimate the number of clusters from the data and used an ensemble of clustering algorithms (K-means, hierarchical, DBSCAN and Gaussian Mixture Model clustering) to identify the clusters.
To visualize the data, we used the following visualization tools: Principle Component Analysis (PCA) and t-distributed Stochastic Neighbor Embedding (T-SNE). To aid in the explainability of the models, we fitted a decision tree to the final clusters to get an idea of which input features are used to identify each of the clusters, with the output of the decision tree being visualized using visualization tools.
We achieved an accuracy of about 70 percent in identifying the clusters from the financial variance data. The ML model succeeded in identifying a few new clusters belonging to a new and previously unseen category, which was validated by the SMEs.
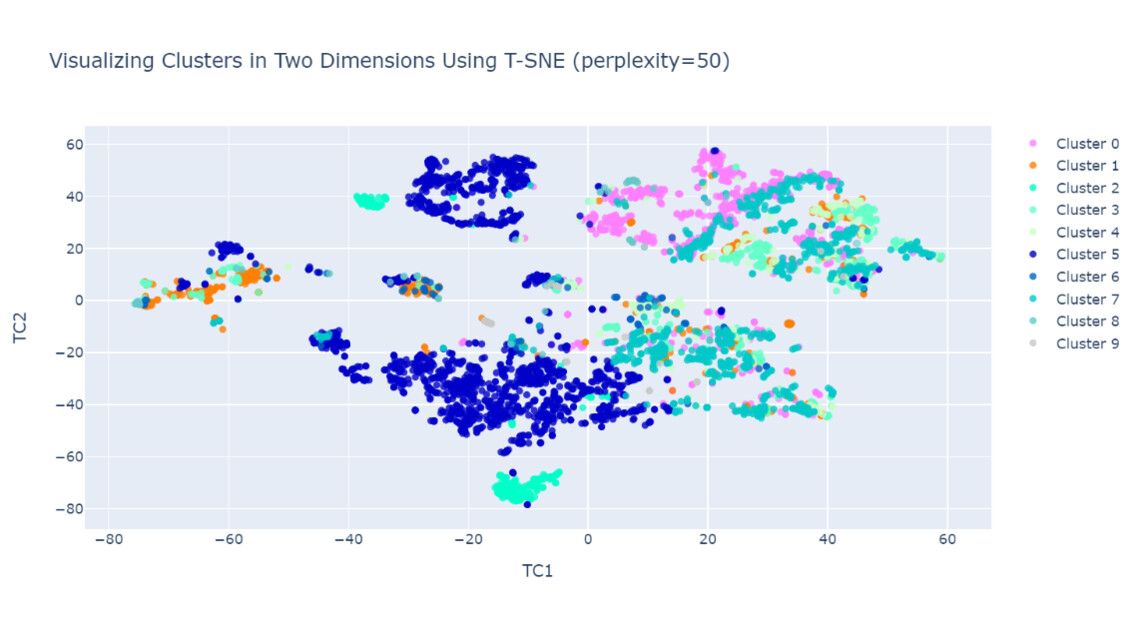
Figure. 2: An illustration of a visualization tool (T-SNE) used with clustering models, to visualize the financial data in different clusters based on their similarity. Different colors correspond to different clusters. From the visualization, one can identify which of the data points are close to other data points and which are outliers. This can be especially useful when prior labels are not available for the data.
Deep learning models with Siamese networks: In our solution, we also explored Siamese networks to identify how close a given data point is to one of the known categories. In this method, deep learning models are trained to distinguish data from a given (known) category and data that is not from the same category. Once trained, a new data point is tested on each of the trained models, one for each of the known categories, to identify which category it is closest to.
Anomaly detection: In some cases, there were some outlier data points that did not fit into one of the known categories of the financial variance (from the supervised algorithm). We used anomaly detection algorithms including isolation forests to detect such points. Once detected, we fed the outlier data to the clustering algorithm to determine if such data might be fitted into one of the existing categories or grouped into a completely new category.
Process for validation
We validated the outputs of our ML models via the standard train test validation, along with a manual validation with the SMEs. Each new set of predicted categories was shared with the experts, who then validated them using the existing system. We then added the validated data to our training set, using it to further tune and refine the ML model. This iterative process resulted in improvements to the ML model predictions over time.
For the existing system, a report on the variances for each day was generated by a rule-based process that took the operators a few hours per day to check manually. In case of some new unknown issues came up, checking the variances could take several hours on some days. It takes about 15 minutes on average to manually categorize every uncategorized variance. The AI-based solution could potentially save a couple of hours of daily manual effort, depending on the transaction volumes for the service provider.
Challenges of using artificial intelligence and machine learning
In the development of our ML solution for the financial variance categorization, we encountered a few challenges. Training the ML model needed the regular availability of the subject matter experts to validate the result, which can sometimes be challenging. We also found that ground truth for categorization was dependent on the experience of the SME and, as such could pose a risk for the quality of model training. Besides, ongoing support is necessary to retrain the models at regular times and monitor the accuracy.
Furthermore, the categorization is just one of the steps in the E2E process of resolving the variance, which is still predominantly manual. Over time however, the investment in ML-based solutions should result in increased performance improvements, as the model is being tuned and its accuracy improves, as well as its ability to identify unseen patterns.
Conclusion
In this article, we have considered the problem of the categorization of financial variance data of CSPs, using machine learning models. We’ve also outlined the steps needed to achieve this. If properly used, with adequate testing and safeguards, our solution can support telecom systems in reducing manual effort and increasing accuracy and efficiency in categorizing financial variance data.
Acknowledgments
The authors would like to thank our stakeholders and subject matter experts for their help throughout the project. We would also like to thank Zeljka Lemaster and Simone Vincenzi for helping to proof read the article and improve it with their valuable suggestions.
Learn more
Find more expert insights about AI and machine learning in the Ericsson Technology Review article library.
Read our blog post on the machine learning lifecycle: How to build robust ML systems.