Visual regression testing: Why visual AI can improve your users’ digital experiences
- English
- Français
Lead Data Scientist
Head of Data Science Chapter
Head of AI Business Enablement, Enterprise Automation & AI
VP and Head of Automation & AI
Lead Data Scientist
Head of Data Science Chapter
Head of AI Business Enablement, Enterprise Automation & AI
VP and Head of Automation & AI
Lead Data Scientist
Head of Data Science Chapter
Head of AI Business Enablement, Enterprise Automation & AI
VP and Head of Automation & AI
Each website is a window into the company’s business and largely impacts how targeted audience perceives the brand. A poorly rendered website with visual defects can ruin the user experience and tarnish credibility. AI and computer vision applied to visual regression testing framework can arrest visual bugs consistently, reduce the amount of code and maintenance required, make the testing team more productive and dramatically increase test coverage.
In this blog post, we will discover how an AI-powered visual test automation framework works and what it means for the web development and testing teams who embark on this fundamentally new way of testing.
What is visual regression testing?
Visual regression testing, also called user interface (UI) testing, is the process of verifying the aesthetic accuracy of everything end-users see and interact with following code changes to any given website. It is different from functional testing which ensures functions and features of the application work properly.
Visual regression tests are designed to find visual ‘bugs’ that otherwise cannot be discovered by functional testing tools, such as misaligned buttons, overlapping images or texts, partially visible elements, responsive layout and rendering issues, etc.
In the example below (as seen in figure 1), a human eye will be able to detect that the web page in the second instance has visual defects. The title and info texts overlap, making the content illegible. To make matters worse, the “Explore Now” button is covered up by text obstructing users from selecting it. These defects will go unnoticed in a functional test since the test will be able to find all the elements and click the button regardless of where it is placed. Scenarios like this can lead to a very unpleasant experience for the end-user and even affect usability.

Figure 1: Baseline and modified images showing visual differences
Traditional visual regression testing approaches and their limitations
Modern websites are composed of hundreds of web pages with millions of elements. Theoretically, applications could be screened manually to identify visual bugs, but manual visual testing is costly, fallible, and quite impractical.
Take an example of a web page running on three operating systems (Windows, MacOS and Android), five browsers (Chrome, Edge, Firefox, IE, and Safari) and twenty resolutions (for standard mobile and laptop/desktop display). A manual tester will need to inspect:
3 X 5 X 20 = 300 screen configurations for just the single web page.
Now, if there were ten applications that needed to be tested across ten different languages and each of these applications had just two pages with code changes per week, then the number will quickly grow into:
300 X 10 X 10 X 2 = 60,000 screen configurations to test every week!
60,000 visual regression tests every week demands a very large quality assurance (QA) team straining their eyes to catch all the visual bugs, although realistically it is a ‘mission impossible’ for humans to spot every visual change, posing a risk of shipping visual bugs into production which can directly affect user experience.
Alternatively, automation engineers could write test assertions and locators to automate visual testing. Love the idea? Wait, there’s a catch. Creating and maintaining complex tests to check the placement of every element on a web page and its styles is tedious and impossible because you can't ascertain visual "correctness" through code.
Traditional approaches thus force organizations to either shrink their test coverage or slow down their releases. Visual AI applied to visual regression test frameworks addresses the limitations of conventional strategies discussed so far.
Visual AI mimics the human eye and brain but doesn't get tired or bored. It combines the strengths of machine learning and computer vision to identify visual defects in a web page.
Before we dive into how visual AI works, let’s review a few commonly used methods of visual testing.
Snapshot or pixel comparison
In this method, a snapshot of the screen is captured and compared with the pixels on a previous version of the page, from the same or a different browser.
Are you able to spot the differences between the left and right images in figure 2a?

Figure 2a: Baseline and modified images for pixel comparison
Even after careful inspection, a human ‘eye’ will fail to spot all the differences. But the pixel method catches all of them (as seen in figure 2b) and in under a millisecond!

Figure 2b: Image with highlighted differences (in red) generated by the pixel comparison model
The pixel method applied to visual testing poses some serious challenges. It struggles with false positives and flags minute changes arising from font anti-aliasing, image rescaling, browser and graphic card rendering which are not visible to the human eye. Besides, it cannot handle dynamic content like a blinking cursor or a page where content is changed regularly. Furthermore, once the subsequent pixels differ, the reported differences can mask a real issue further down the page.
Document object model (DOM) comparison
The document object model (DOM) is a programming interface for web documents. It represents the page as nodes and objects so that programs can change the document structure, style, and content.
The DOM comparison model matches the DOM trees of the baseline and test pages and highlights the changes between the nodes of the trees. In the below example, the text in the left and right pages “5G in India” may appear to have visually identical fonts, however, the fonts have two major differences that can be identified from their DOMs – the font style in the left is ‘Helvetica’ while that in the right is ‘Arial’, also the font size on the right has increased by 1 unit.
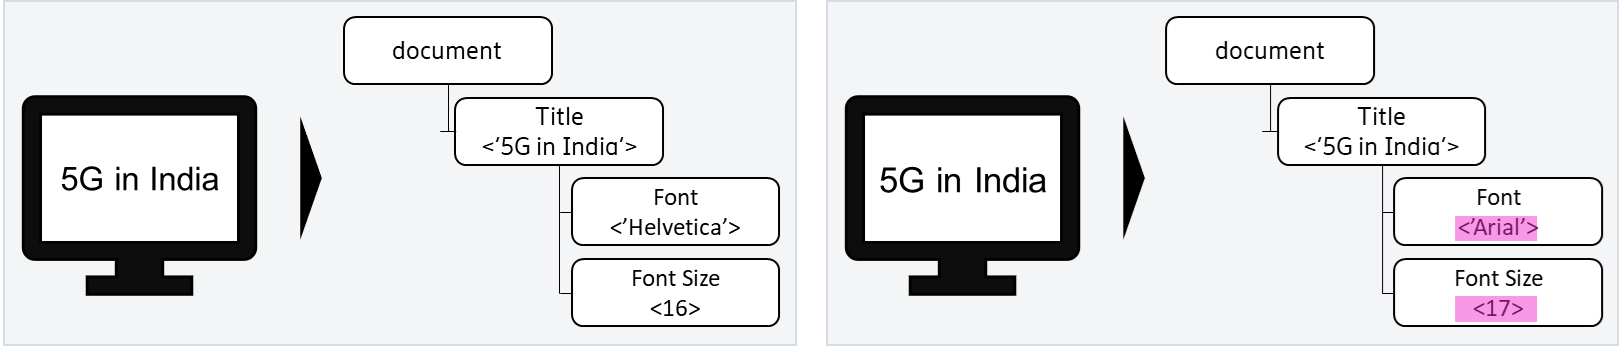
Figure 3: Baseline and modified pages with highlighted DOM differences
While the DOM approach may seem like a no-brainer straightforward solution for visual test automation, there is more than meets the eye.
Firstly, the DOM contains both rendered and non-rendered content, so a simple page restructure can fill the DOM comparison with ‘correctly identified’ differences but that are false positives from a visual testing perspective.
And secondly, the DOM comparison cannot detect rendering changes. A new image file uploaded to a page with the old file name will go unnoticed even though the user sees a difference on the rendered page.
Hence DOM comparisons on their own are insufficient for ensuring visual integrity.
How does visual AI work?
Visual AI overcomes the problems of pixel and DOM approaches. It identifies visual elements that make up a screen or page. Rather than inspecting individual pixels, visual AI uses computer vision to recognize elements as elements with properties (dimension, color, content, placement, etc.) like a human eye and uses the properties of a checkpoint element to compare it to the baseline and spot visible differences.
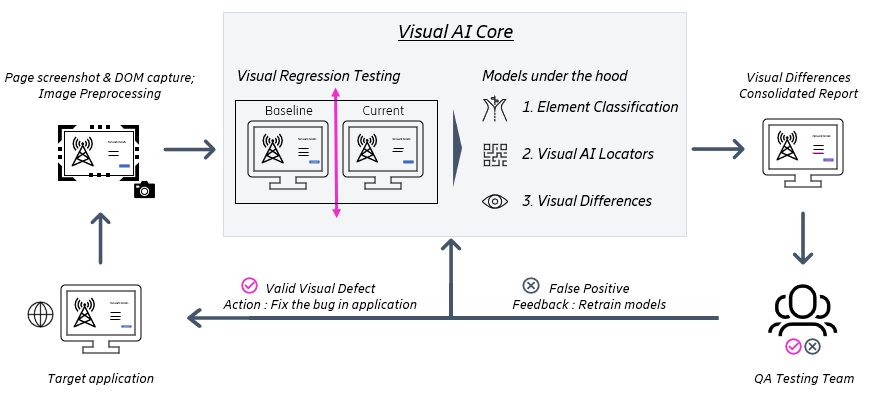
Figure 4: Workflow of the visual AI solution
Step 0: Data collection and preprocessing
The solution captures baseline UI and the DOM after every successful release and stores them for future tests. When new changes are pushed to the test environment, screenshots and DOM from the modified web pages are captured. Before feeding the images to the models, the images are pre-processed and corrected for size, orientation, and color. This ensures the baseline and current images are comparable.
Step 1: Element classification
At the beginning, the model inspects the elements in the DOM of the web page and that are relevant from a visual testing perspective, learning from previous test history. It also identifies elements that need to be ignored and filters them out. The model traverses the baseline and test DOM trees to detect changes, additions, and deletions of these visual elements.
Step 2: Visual AI locators
The visual AI solution then uses computer vision to find pre-defined visual locators on a web page. Visual locators are components on a page like buttons, tables, etc. The model learns these visual locators and scans the modified screenshots to find these locators on the web page. If the model is not able to find a locator on the modified screenshot that appears on the baseline, it flags the discrepancy as a defect. Below is an example, where the modified page screenshot does not have the “Support” button on the main menu. Also, the name of the button “Me & My Unit” has been modified to “My Unit”. These visual defects will be detected by the visual AI model and highlighted for the QA testing team to action upon.
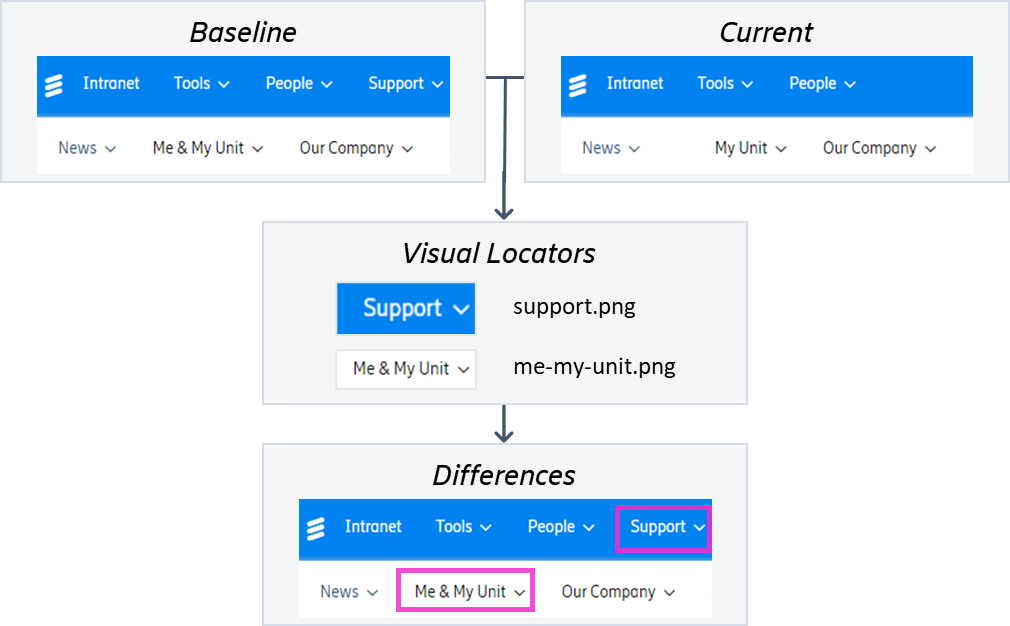
Figure 5: Visual AI model uses visual locators to flag defects on a modified web page
Step 3: Visual Differences
Finally, the model compares the locators and elements on the baseline and modified pages to find visual differences. Figure 6 below shows baseline and current screenshots from a webpage and the highlighted differences that are identified by the Visual AI solution. The model can detect the overlapping texts as well as the missing “Explore the report” button.
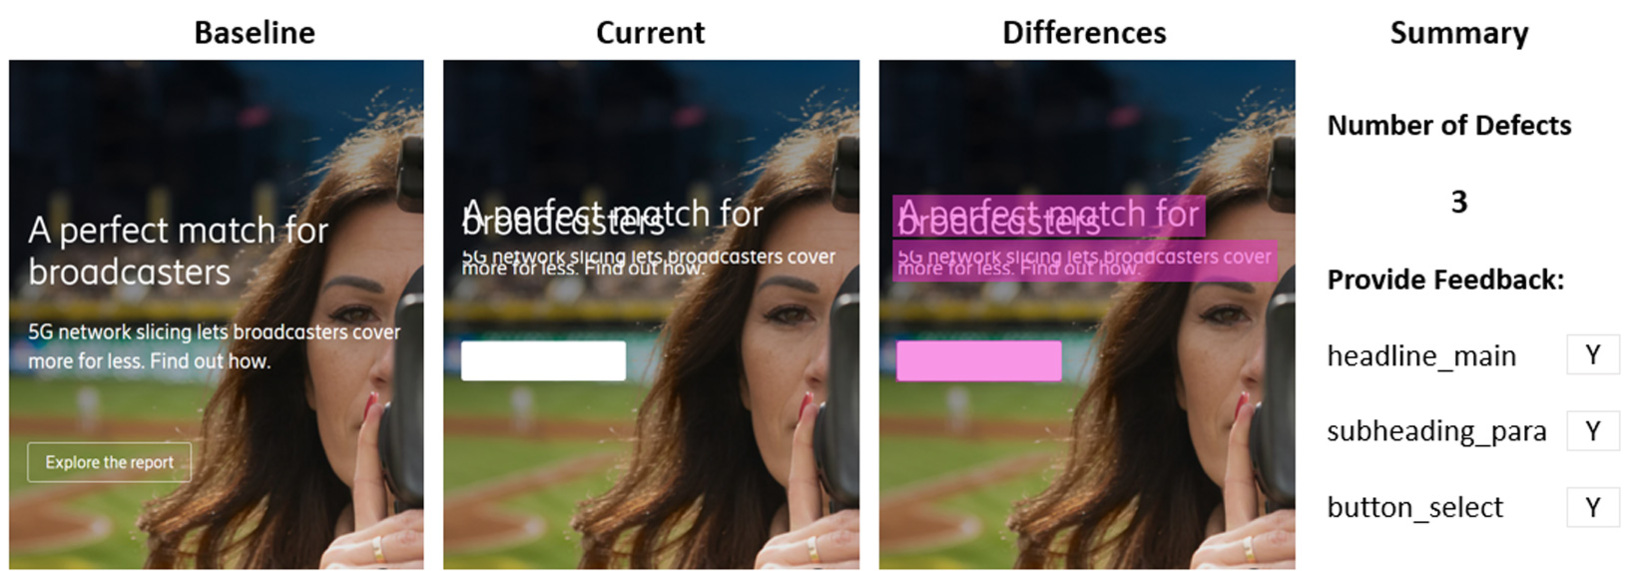
Figure 6: Visual AI solution highlights the differences
The visual AI solution prepares a consolidated report for all the tests it performed that includes page screenshots with clearly marked visual differences.
The model can be run in batch mode to support tests on several web pages across different browsers, screens, and operating systems.
The defects that are detected by the model can get routed to the development team for a resolution. Also, the feedback from the testing team on accuracy of the tests are fed into the model for continuous re-training and model improvement.
The visual AI approach beats pixel and DOM based visual tests since it has the intelligence to:
- Ignore minor visual differences caused by shift of a few pixels during rendering on different browsers
- Recognize which elements are visual and which are not, just like a human can do, and
- Gauge which visual elements are allowed to move on a page and ignores them across all screens
What next for visual regression testing?
The world is progressing towards an application-driven society where humans are increasingly leveraging technology applications for every aspect of their lives – be it entertainment, leisure, work, or hobbies. The number of applications has exploded and the need for omnichannel seamless user experience has become necessity, not luxury.
Organizations need to provide the same application experience whether a user uses Microsoft Edge in her laptop or Chrome in her mobile. Beyond the traditional choices, people are starting to access their apps through consoles, tablets, and wearables. Also, experiences are taking over as primary lever of user engagement rather than mere functionalities. It is impossible to keep up with the traditional human-centric approach of visual testing, and AI based test automation is the need of the future. Bringing AI into the core of visual testing solves many problems organizations are currently facing. We have demonstrated in this use case that AI driven test automation is not a concept, but a practical solution that meets core business needs, as well as being capable of scale, and creating a foundation for the next generation of test automation.
Learn more
Read more about AI in networks.
Read our blog post about Machine learning signature verification: How to enhance responsible sourcing with automated compliance
Learn more about Machine Learning-powered Demand Forecasting
Explore how AI can be used in environmental sustainability
Explore 5G.