








Live voice and video assistants, real-time multimodal capture, on-device agents and augmented reality/artificial intelligence (AR/AI) glasses all share a property that sets them apart from much of the mobile traffic of the last decade: they send far more data than they receive.
This development is creating a new type of demand for mobile networks. Instead of simply consuming content from the network, devices can continuously send voice, video, images, sensor information and other context to artificial intelligence (AI) services. The resulting traffic is net-new and, for many generative AI (GenAI) applications, strongly uplink (UL) heavy.
Not all AI-enabled devices and applications have the same requirements, however. Some applications generate relatively modest traffic, while others depend on sustained UL performance to provide an interactive experience. This distinction matters because a network can have sufficient aggregate capacity while still failing to provide enough UL throughput to users at the cell edge, an issue that often expands to mid-cell users.
The research presented in this article focuses on the GenAI applications that create net-new traffic and, in particular on the UL requirements of interactive services. We examine three diverse real deployment scenarios – a Northeast Asian dense-urban network, a US urban network and a US suburban network – to understand whether existing 5G deployments can support this emerging demand and assess
how requirements will evolve toward 2031.
GenAI adoption: uptake is uncertain, so we model three levels, using smartphone AI assistants as the example: moderate (9 percent of the population), medium (43 percent) and high (100 percent). We based these estimates on forecasts made by different analysts. Medium is our main reference point.
UL demand in 2031: roughly three to six times today’s busy-hour level, depending on deployment and adoption level. This includes MBB growth and FWA where present.
Cell-edge target: 1.5Mbps per user at the 5th percentile of user throughput. A network that falls short even at light load is UL coverage-deficient.
Can today’s networks support generative artificial intelligence traffic?
Before looking at how much GenAI traffic may be generated in the future, it is useful to ask a more basic question: can today’s networks provide the UL performance these applications need right now?
GenAI interactive services — including live voice and video assistants, real-time multimodal capture and on-device agents streaming context to the cloud — require a sustained per-user UL bitrate. Aggregate cell capacity is not enough if users at the edge of the cell cannot achieve the required throughput.
According to the June 2026 edition of Ericsson Mobility Report [1], 1.5Mbps is a minimum practical benchmark for the UL throughput needed for interactive GenAI. This corresponds to the required throughput of the worst-served 5 percent of users (the 5th percentile). We have chosen to use this figure as the starting point for our analysis. If celledge users cannot reach the required rate, the service can degrade or fail regardless of how much capacity remains available elsewhere in the cell. This makes UL coverage an important part of the GenAI network requirement.
Today’s 5G networks are optimized for the downlink (DL), reflecting the much larger volume of DL traffic generated by traditional mobile broadband (MBB) and, where applicable, fixed wireless access (FWA) services such as video streaming and web content. Over the past couple of decades, spectrum configuration, link budgets and cell-selection strategies have been shaped by this much larger volume of DL traffic. The UL, however, faces a different constraint: users at the cell edge have limited transmit power, while the bands providing most of the network’s DL capacity are not necessarily the bands that provide the best UL coverage.
Field measurements and today’s network configurations provide a baseline for the analysis. We selected three deployments spanning different network densities: Northeast Asian dense urban (Taipei, Taiwan), US urban (San Jose, California) and US suburban (Spring Hill, Florida). In the 2025 live-network data, the observed busy-hour UL traffic densities were 310, 40 and 8Mbps/km², respectively. The corresponding measured cell-edge UL throughputs were 0.8, 0.3 and 0.25Mbps in the busiest hour. We reproduced each deployed network configuration, including its DL-prioritized cell selection, in a radio-network simulator and checked the results against measurements at the observed operating load.
Figure 1 illustrates how the simulated cell-edge UL throughput changes as traffic density varies. Its curves are not field measurements across the full load range, but the measured and simulated network performance are sufficiently close for the current work.
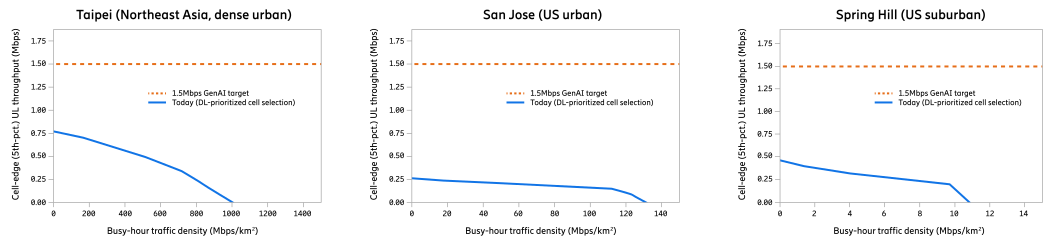
Figure 1: Simulated cell-edge (5th-percentile) UL user throughput versus busy-hour traffic density for the three networks as configured today; all three sit well below the 1.5Mbps GenAI cell-edge target across the load range
Figure 1 shows a clear UL coverage gap. Even at light load, cell-edge throughput is only about 0.8Mbps in the Northeast Asian dense-urban scenario, 0.25Mbps in the US urban scenario and 0.5Mbps in the US suburban scenario, all well below the 1.5Mbps target. Cell-edge throughput declines further as network load increases.
The higher low-load throughput in suburban Spring Hill than in urban San Jose partly reflects the different propagation models and simulated environments used for the two simulations; the suburban model is more optimistic at light load. The absolute values should therefore not be read as a like-for-like comparison of the two deployments.
The gap is structural rather than incidental. Because these networks were dimensioned and tuned primarily for the DL, the UL link budget and cell-selection strategy leave cell-edge users with insufficient performance. This is what we mean by coverage-deficient in the UL: the network cannot provide the required cell-edge UL throughput to the worst-served users even at today’s load, before the additional GenAI-driven demand arrives.
It should be noted that the underlying 4G layer also falls short of the 1.5Mbps UL cell-edge target in field measurements. A detailed 4G analysis is outside the scope of this article, but the legacy layer does not change the overall conclusion.
Looking at these results, it becomes clear that the question is not simply how much additional traffic GenAI will generate. We must also consider whether the network can deliver the required UL performance as that traffic grows.
What happens as generative artificial intelligence traffic grows?
To understand how the network will respond as GenAI adoption increases, we need to estimate future traffic demand and test it against representative network deployments. For each of the three scenarios, we estimate busy-hour UL demand from the 2025 (full year) baseline to 2031. The methodology follows the modeling detailed for the US urban scenario in a recent Ericsson Mobility Report article [2], applied consistently to all three scenarios with scenario-specific inputs including subscriber and population density, communication service provider market share and FWA share.
The projected growth in MBB traffic – a 13 percent compound annual growth rate (CAGR) in the US scenarios and a 12 percent CAGR in the Northeast Asian scenario – is based on the June 2026 Ericsson Mobility Report [1]. A net-new GenAI contribution from AR/AI glasses, smartphone AI applications, AI/AR gaming, AI companions and AI monitoring cameras is then added on top [2][3]. Because the pace of GenAI adoption is uncertain, we consider three adoption levels, illustrated here by smartphone AI assistant uptake – moderate (9 percent of the population), medium (43 percent) and high (100 percent) – and use medium adoption as the main reference point.
Under medium adoption, the three scenarios show substantial UL growth by 2031, as presented in Table A in Figure 2. In the US urban scenario, for example, demand grows from a 2025 busy-hour baseline of 40Mbps/km² UL to about 120Mbps/km² by 2031, which is roughly three times. The UL share of total traffic rises from 10 to 14 percent, while about 20 percent of traffic is FWA.
Table A – Baseline busy-hour uplink demand versus 2031 demand under medium GenAI adoption
| Scenario | UL baseline (Mbps/km²) | UL 2031 (Mbps/km²) | UL growth | UL share of total 2031 |
| US suburban | 8 | 48 | 6x | 13% |
| US urban | 40 | 120 | 3x | 14% |
| Northeast Asia, dense urban | 310 | 860 | 3x | 14% |
Table B – Baseline simulation configuration for the three deployment scenarios
| US suburban | US urban | Northeast Asia, dense urban |
|
| Average inter-site distance | 3.5km | 1.2km | 250m |
| Subscriber density | 350/km² | 1,155/km² | 12,000/km² |
| Low-band FDD bandwidth | 2x20MHz | 2x20MHz | - |
| Mid-band FDD bandwidth | 2x50MHz | 2x40MHz | 2x20MHz |
| Mid-band TDD bandwidth | 160MHz | 160MHz | 90MHz |
| Radios | FDD 4T4R; TDD advanced |
FDD conventional; TDD advanced |
FDD conventional; TDD advanced |
| FWA share (busy hour) including DL and UL | 25% | 20% | None |
Figure 2: Busy-hour uplink demand (A) and network configurations (B)
In the US suburban scenario, busy-hour UL demand grows from about 8Mbps/km² in 2025 to about 48Mbps/km² in 2031, which is roughly six times. FWA is a major source of DL-heavy traffic, with some forecasts expecting it to account for about 60 percent in 2031. Even so, the UL remains at only about 13 percent of total traffic.
In the Northeast Asian dense-urban scenario, with 12,000 subscribers/km² and no FWA overlay, busy-hour UL demand grows from 310Mbps/km² in 2025 to about 860Mbps/km² by 2031, which is nearly three times. The UL share of total traffic rises from 10 to 14 percent.
Across all three scenarios, even at medium adoption, GenAI accelerates UL growth by roughly three to six times by 2031, while the UL remains a minority of total traffic.
The DL remains the dominant direction in every scenario. Under medium adoption in 2031, busy-hour DL demand reaches about 720Mbps/km² in US urban, about 320Mbps/km² in US suburban and about 5,500Mbps/km² in Northeast Asian dense-urban scenarios, which is roughly six to seven times the corresponding UL in each case.
The important distinction is that most of this DL growth is not net-new GenAI traffic. Traditional MBB and, where present, FWA continue to drive DL demand, while the GenAI contribution lands overwhelmingly in the UL. The UL therefore becomes the more immediate constraint for the GenAI services considered here, even though it remains the smaller traffic direction overall.
The network configuration behind the uplink gap
Table B in Figure 2 summarizes the key parameters used in the simulations, with values following typical real-world deployments. Site density rises by more than an order of magnitude from suburban to dense urban, while the coverage-defining FDD (frequency division duplex) bandwidth stays thin throughout. Our analysis considers the 5G network only. A 4G network also underlies each scenario, but it is excluded here to keep the focus on the 5G UL.
While the three scenarios represent different points on the network-density spectrum, they share a layered structure that is important for understanding their UL performance. The spectrum in each network falls into three broad categories that behave differently for the UL:
- Low-band FDD
- Mid-band FDD
- Mid-band TDD (time division duplex).
Low-band FDD spectrum lies below 1GHz, typically with 5–20MHz of bandwidth in each direction (UL and DL). How much low-band spectrum is available varies by operator and market. Low-band FDD spectrum provides the best propagation and therefore helps define the cell edge. It is present in both US scenarios but not in the Northeast Asian dense-urban 5G network studied here. This does not imply that every dense-urban Northeast Asian city lacks a 5G low-band layer, but it appears typical for Taiwan and is a reasonable starting point for our analysis.
The three networks differ in density but face the same celledge problem: users in unfavorable propagation conditions are often served on mid-band TDD. High path loss limits their UL throughput. Steering them to mid-band FDD does little to overcome that constraint, while the presence of low-band FDD does not by itself help when their UL traffic remains on mid-band TDD. The gap is therefore driven by where UL traffic is carried, not simply by whether a lower-frequency layer is available.
Addressing the uplink gap in 5G networks
Our simulation results indicate that the first wave of GenAI demand can be addressed by strengthening the UL with targeted 5G radio access network (RAN) solutions such as:
- UL-aware advanced multi-layer coordination (UL-AMLC), which steers users toward the band with the best potential UL throughput rather than prioritizing DL throughput.
- UL carrier aggregation (CA), which lets a device transmit on a lower-frequency FDD carrier and a mid-band TDD carrier at the same time, combining the coverage of the lower band with the capacity of the higher one.
- Midband FDD Massive MIMO and 8R antennas on low band, which add receive antenna branches at the base station to improve the UL link budget and lift cell-edge throughput.
- Coordinated multipoint (CoMP), which lets several sectors receive and combine a user’s UL signal, improving reception at the cell edge. If the sectors are located on the same site the feature is often referred to as intra-site UL CoMP, if the sectors are located on different sites, the feature is called inter-site UL CoMP.
These features can be combined selectively, depending on the deployment and improve both cell-edge performance and the traffic load that the network can support, while maintaining the 1.5Mbps target. It should be noted that not all possible features that can strengthen the UL are included in this analysis [4].
The effect of these features differs between the three deployments. In the US urban deployment scenario, for example, with UL-AMLC, the network initially supports the cell-edge target only up to about 24Mbps/km² of UL traffic. UL-AMLC together with advanced FDD antennas raises this ceiling substantially, enough to meet moderate GenAI adoption in 2031. Adding further features raises the supported traffic density to about 95Mbps/km², which is below the 120Mbps/km² medium 2031 demand.
The sparse suburban grid of the US suburban deployment scenario starts further behind. UL-AMLC alone raises celledge UL throughput from below 0.5Mbps to more than 5Mbps at low load. But even applying the full feature chain, including CA and advanced antennas, will not be able to keep the cell edge above the 1.5Mbps target across the modeled load range. The network will not be able to cover the 2031 demand assuming the 1.5Mbps cell-edge user throughput target. Much of the suburban demand growth is driven by FWA rather than MBB.
It must be noted that some of the upgrades (such as ULAMLC), may have a negative effect on the DL cell edge throughput. The effect is expected to be small, however, with negligible impact on user experience even in the case of DL-heavy video streaming. Adding FDD massive MIMO increases the user throughput to a level where even very demanding applications can be used almost everywhere.
The Northeast Asian dense-urban deployment scenario illustrates a different solution. This network has no lowband FDD layer, so the UL relies on mid-band FDD and TDD. Adding a low-band FDD without changing the traffic steering policies has little effect on the cell-edge user throughput. The decisive step is implementing the UL-AMLC. It increases low-load cell-edge UL throughput to 17Mbps and allows the network to sustain performance beyond the 2031 demand point.
In this case, the mechanism is partly to offload the TDD and FDD mid-band. Low-band FDD can carry deep-indoor and far-edge users that would otherwise consume mid-band resources, freeing capacity for other users. The result is a different path to the same goal: better UL coverage and sufficient capacity to support growing GenAI demand.
Figure 3 shows the cumulative effect of the RAN features on cell-edge UL throughput and the traffic density the networks can support in each of the three deployment scenarios. The dotted vertical line in each graph marks the 2031 medium GenAI UL demand.
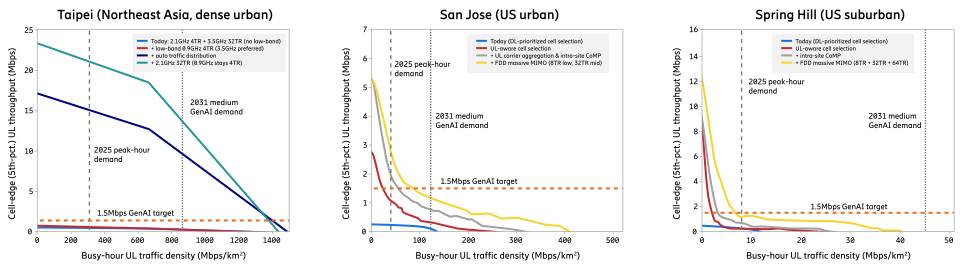
Figure 3: RAN features applied cumulatively to each scenario, plotted as cell-edge (5th-percentile) UL throughput versus busy-hour traffic density
In the two US networks, the chain runs from DL-prioritized cell selection through UL-prioritized selection, UL CA, and intra-site CoMP with progressively stronger FDD antennas. In the Northeast Asian dense-urban network, CoMP was not applied. Deploying low-band FDD bands on all the sites following the implementation of UL-AMLC and deploying FDD massive MIMO on midband radios improve performance. Each feature lifts the curve; the full chain moves each network above the 1.5Mbps GenAI target and raises the traffic density it can carry.
The results show that the first wave of GenAI demand does not necessarily require a new generation of mobile technology. Existing 5G networks can be strengthened with targeted RAN improvements. However, the required mix depends strongly on the deployment.
The impact of generative artificial intelligence on future network development
The analysis points to two different stages in the evolution of the UL. The first is already visible today. GenAI applications that create net-new traffic can be strongly UL-heavy, while today’s networks are still optimized primarily for the DL. As a result, cell-edge UL performance can become a constraint even before GenAI traffic has reached its projected 2031 levels.
The second is the growth that follows. Across the three scenarios, medium GenAI adoption will increase the UL traffic demand roughly three to six times by 2031. Targeted 5G RAN features can address this first wave, but the margin becomes smaller as application requirements and adoption increase.
The 1.5Mbps benchmark used in this analysis is a floor rather than a ceiling. Future GenAI applications are likely to require higher sustained UL bitrates. The simulations show that when the required cell-edge bitrate increases, the traffic density each network can support falls sharply. Even with the studied 5G feature improvements, the US urban and US suburban networks fall short once the target rises into the 1.5–5Mbps range [5].
This points toward a change in how mobile networks need to treat the UL. Rather than being primarily a consequence of DL-oriented network design, UL performance needs to become a first-class consideration as AI-native applications become more capable and more widely adopted.
Beyond 2031, the studied incremental 5G improvements are likely to become insufficient as both adoption and application requirements increase. This creates a stronger motivation for 6G technologies and architectures that can provide higher UL performance as an integral part of the air interface. UL-DL decoupling, among other possible improvements, has shown promising results and could be one part of that evolution [4]. A recent Ericsson blog post [6] outlines solutions for 6G that target UL performance.
Conclusion
Generative AI (GenAI) is changing the traffic profile of mobile networks, creating a growing need for sustained uplink (UL) performance. Our analysis shows that this challenge is already visible in today’s 5G networks, where cell-edge UL performance can fall well below the requirements of interactive GenAI services.
Targeted RAN (radio access network) enhancements can strengthen the UL and support the initial GenAI-driven demand. The studied features help to meet the demand through 2031. However, urban and suburban deployments will likely struggle to meet the demand beyond the initial GenAI app adoption. As GenAI applications become more popular, the scope for incremental 5G improvements becomes more limited.
UL performance therefore needs to be considered as a fundamental part of future network design. As 6G evolves, technologies and architectures that provide stronger and more flexible UL capabilities will be important in enabling the next generation of AI-native mobile services.
Further reading



References
Authors

Allan Tart

Fredric Kronestedt

Jun Ying Liu